ABOUT US
We are security engineers who break bits and tell stories.
Visit us
doyensec.com
Follow us
@doyensec
Engage us
info@doyensec.com
Blog Archive
© 2026 Doyensec LLC 
OAuth2’s popularity makes it a prime target for attackers. While it simplifies user login, its complexity can lead to misconfigurations that create security holes. Some of the more intricate vulnerabilities keep reappearing because the protocol’s inner workings are not always well-understood. In an effort to change that, we have decided to write a comprehensive guide on known attacks against OAuth implementations. Additionally, we have created a comprehensive checklist. It should prove useful for testers and developers alike to quickly assess whether their implementation is secure.
Download the OAuth Security Cheat Sheet Now! Doyensec_OAuth_CheatSheet.pdf.
OAuth is a complex protocol with a many actors and moving parts. Before we dive into its inner workings, let’s review its terminology:
Attacks against OAuth rely on challenging various assumptions the authorization flows are built upon. It is therefore crucial to understand the flows to efficiently attack and defend OAuth implementations. Here’s the high-level description of the most popular of them.
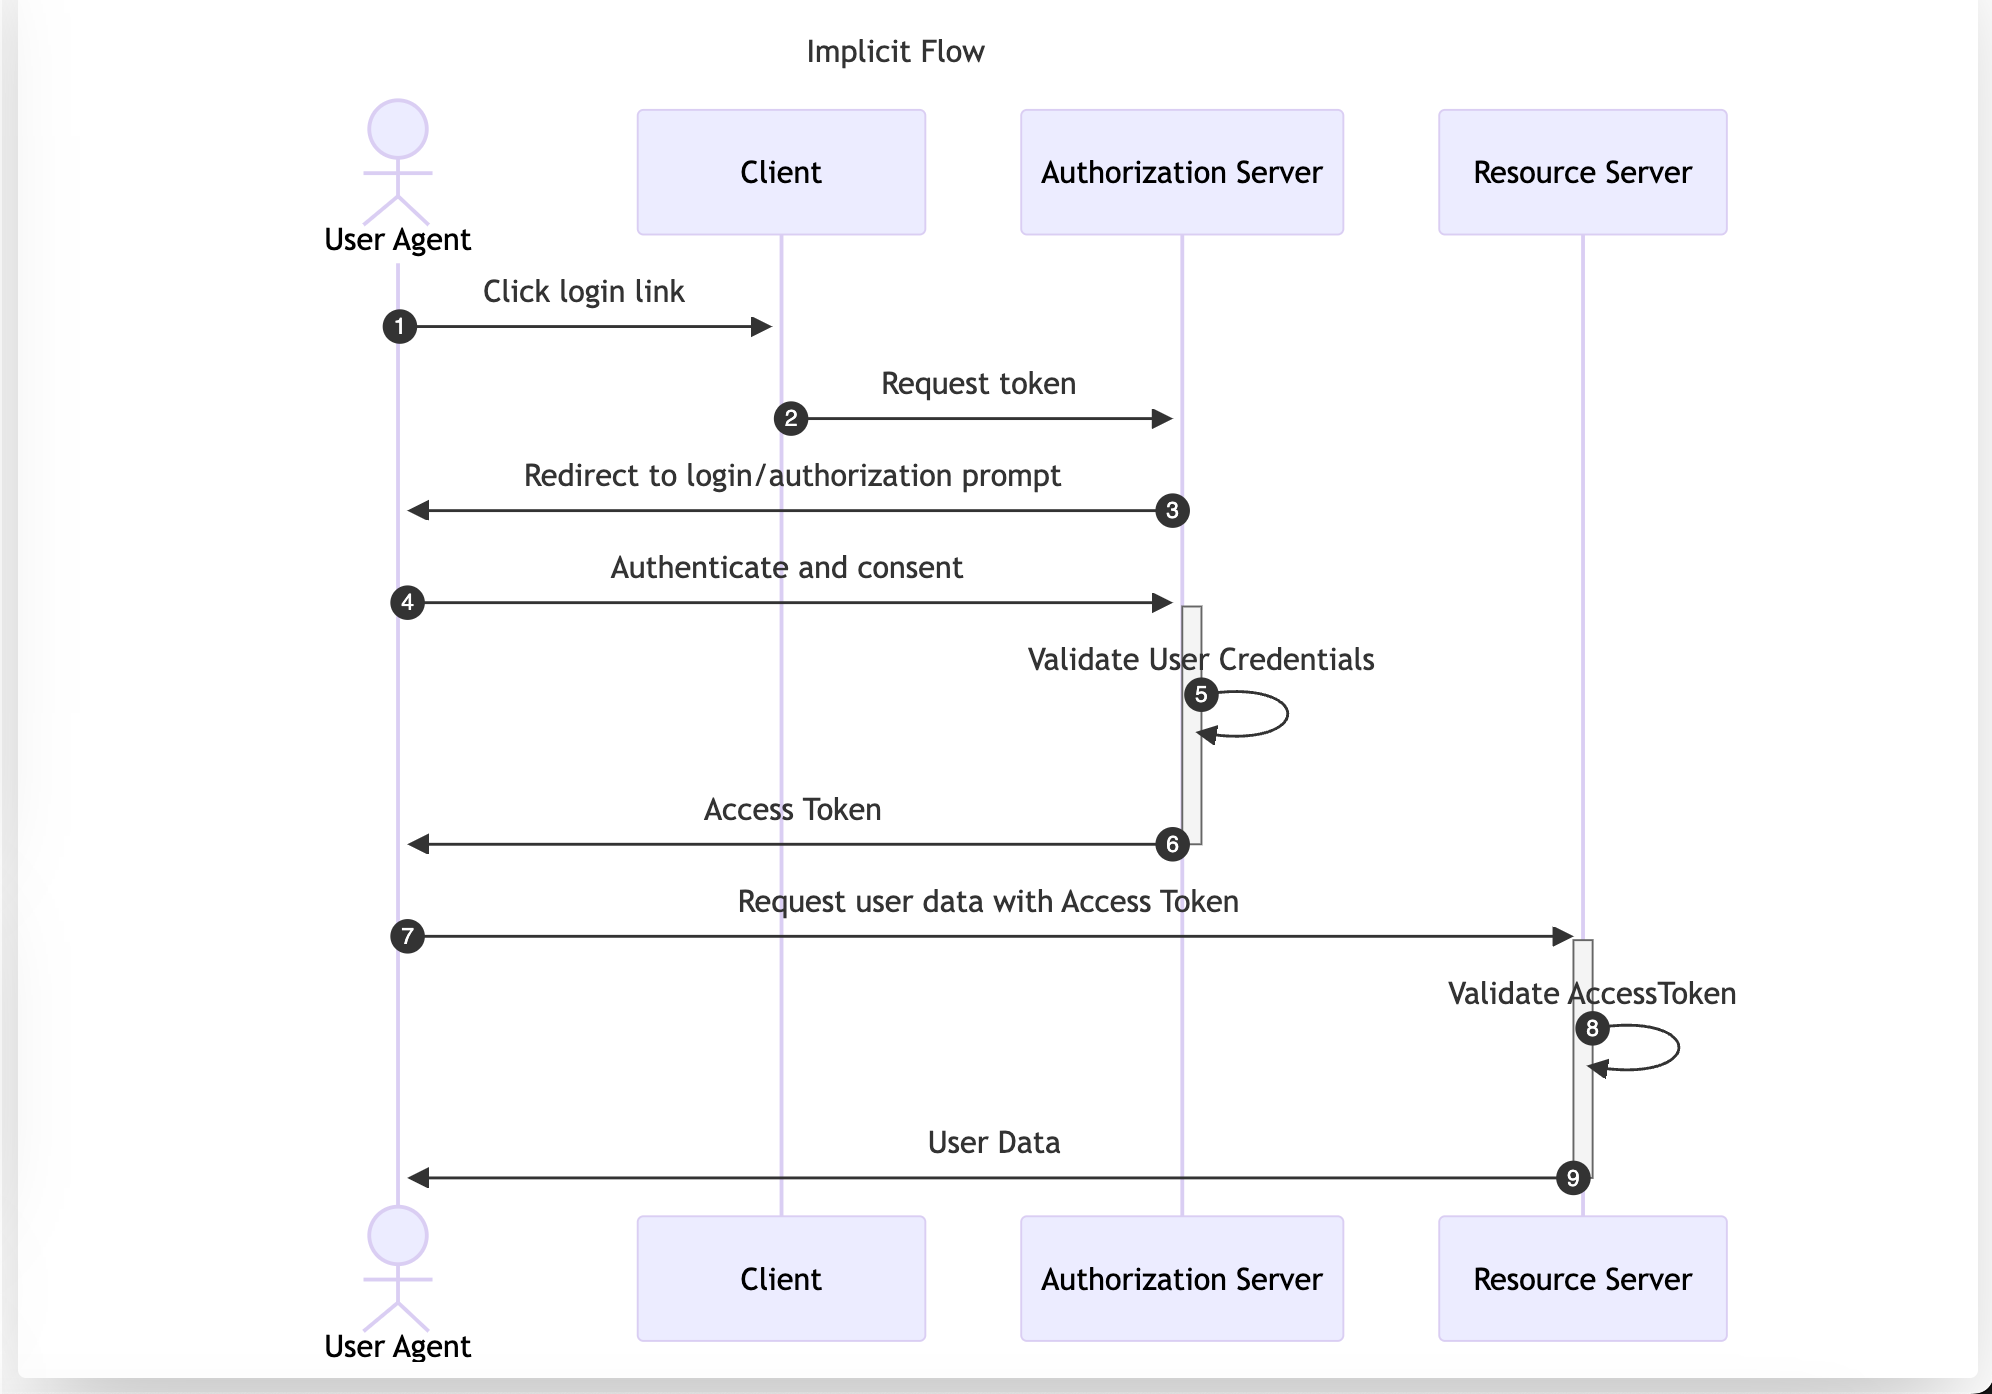
The Implicit Flow was originally designed for native or single-page apps that cannot securely store Client Credentials. However, its use is now discouraged and is not included in the OAuth 2.1 specification. Despite this, it is still a viable authentication solution within Open ID Connect (OIDC) to retrieve id_tokens.
In this flow, the User Agent is redirected to the Authorization Server. After performing authentication and consent, the Authorization Server directly returns the Access Token, making it accessible to the Resource Owner. This approach exposes the Access Token to the User Agent, which could be compromised through vulnerabilities like XSS or a flawed redirect_uri validation. The implicit flow transports the Access Token as part of the URL if the response_mode is not set to form_post.
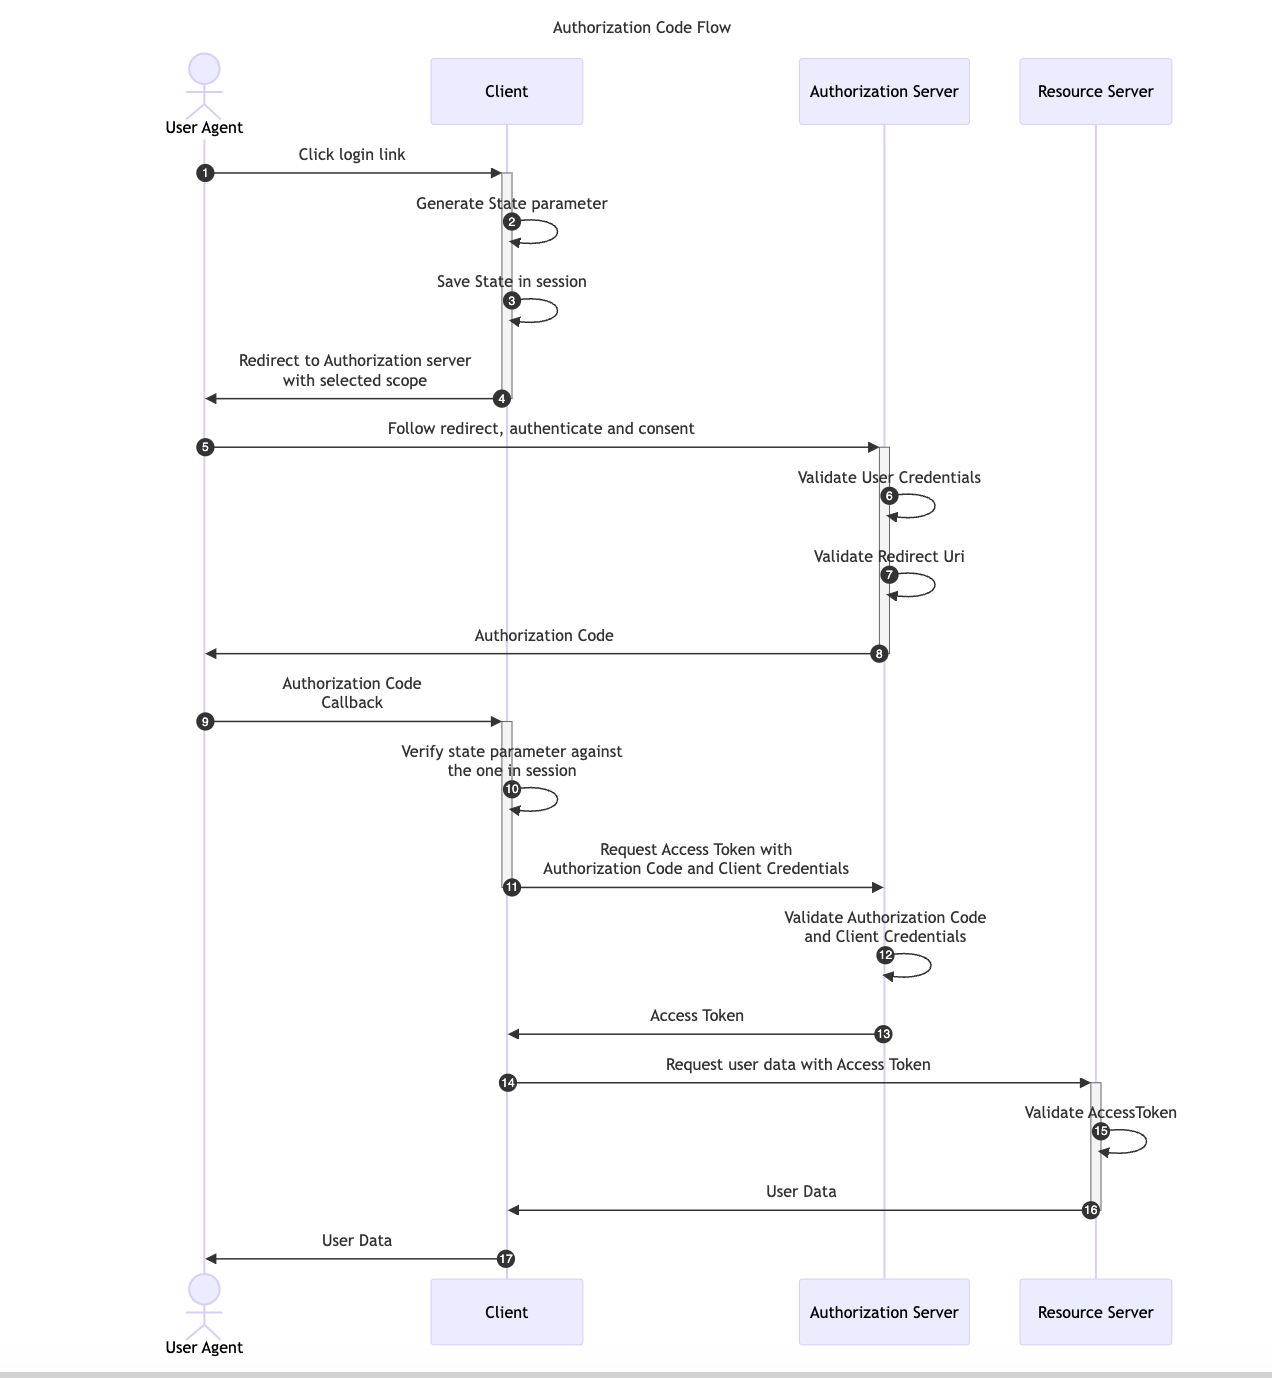
The Authorization Code Flow is one of the most widely used OAuth flows in web applications. Unlike the Implicit Flow, which requests the Access Token directly to the Authorization Server, the Authorization Code Flow introduces an intermediary step. In this process, the User Agent first retrieves an Authorization Code, which the application then exchanges, along with the Client Credentials, for an Access Token. This additional step ensures that only the Client Application has access to the Access Token, preventing the User Agent from ever seeing it.
This flow is suitable exclusively for confidential applications, such as Regular Web Applications, because the application Client Credentials are included in the code exchange request and they must be kept securely stored by the Client Application.
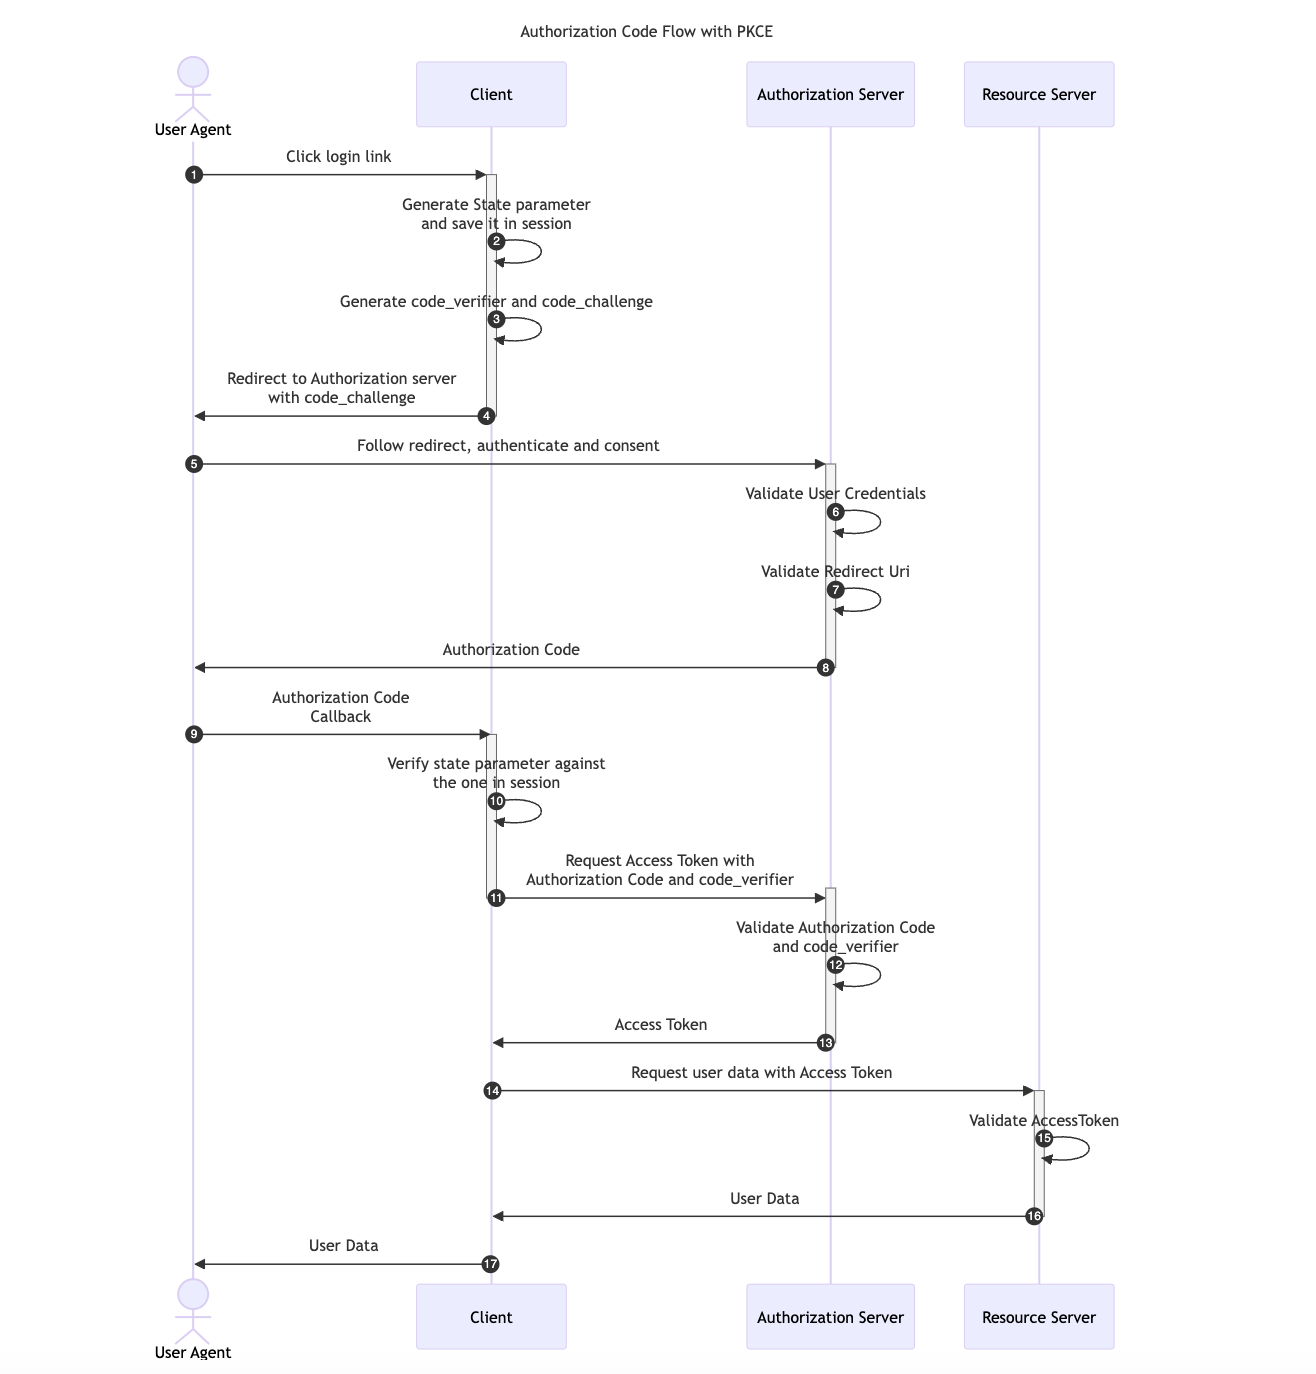
OAuth 2.0 provides a version of the Authorization Code Flow which makes use of a Proof Key for Code Exchange (PKCE). This OAuth flow was originally designed for applications that cannot store a Client Secret, such as native or single-page apps but it has become the main recommendation in the OAuth 2.1 specification.
Two new parameters are added to the default Authorization Code Flow, a random generated value called code_verifier and its transformed version, the code_challenge.
code_verifier and derives a transformed version t(code_verifier), referred to as the code_challenge, which is sent in the Authorization Request along with the transformation method t_m used.code_verifier secret.code_verifier and compares it to t(code_verifier)The available transformation methods (t_m) are the following:
code_challenge = code_verifiercode_challenge = BASE64URL-ENCODE(SHA256(ASCII(code_verifier)))Note that using the default Authorization Code flow with a custom redirect_uri scheme like example.app:// can allow a malicious app to register itself as a handler for this custom scheme alongside the legitimate OAuth 2.0 app. If this happens, the malicious app can intercept the authorization code and exchange it for an Access Token. For more details, refer to OAuth Redirect Scheme Hijacking.
With PKCE, the interception of the Authorization Response will not allow the previous attack scenario since attackers would only be able to access the authorization_code but it won’t be possible for them to get the code_verifier value required in the Access Token Request.
The diagram below illustrates the Authorization Code flow with PKCE:
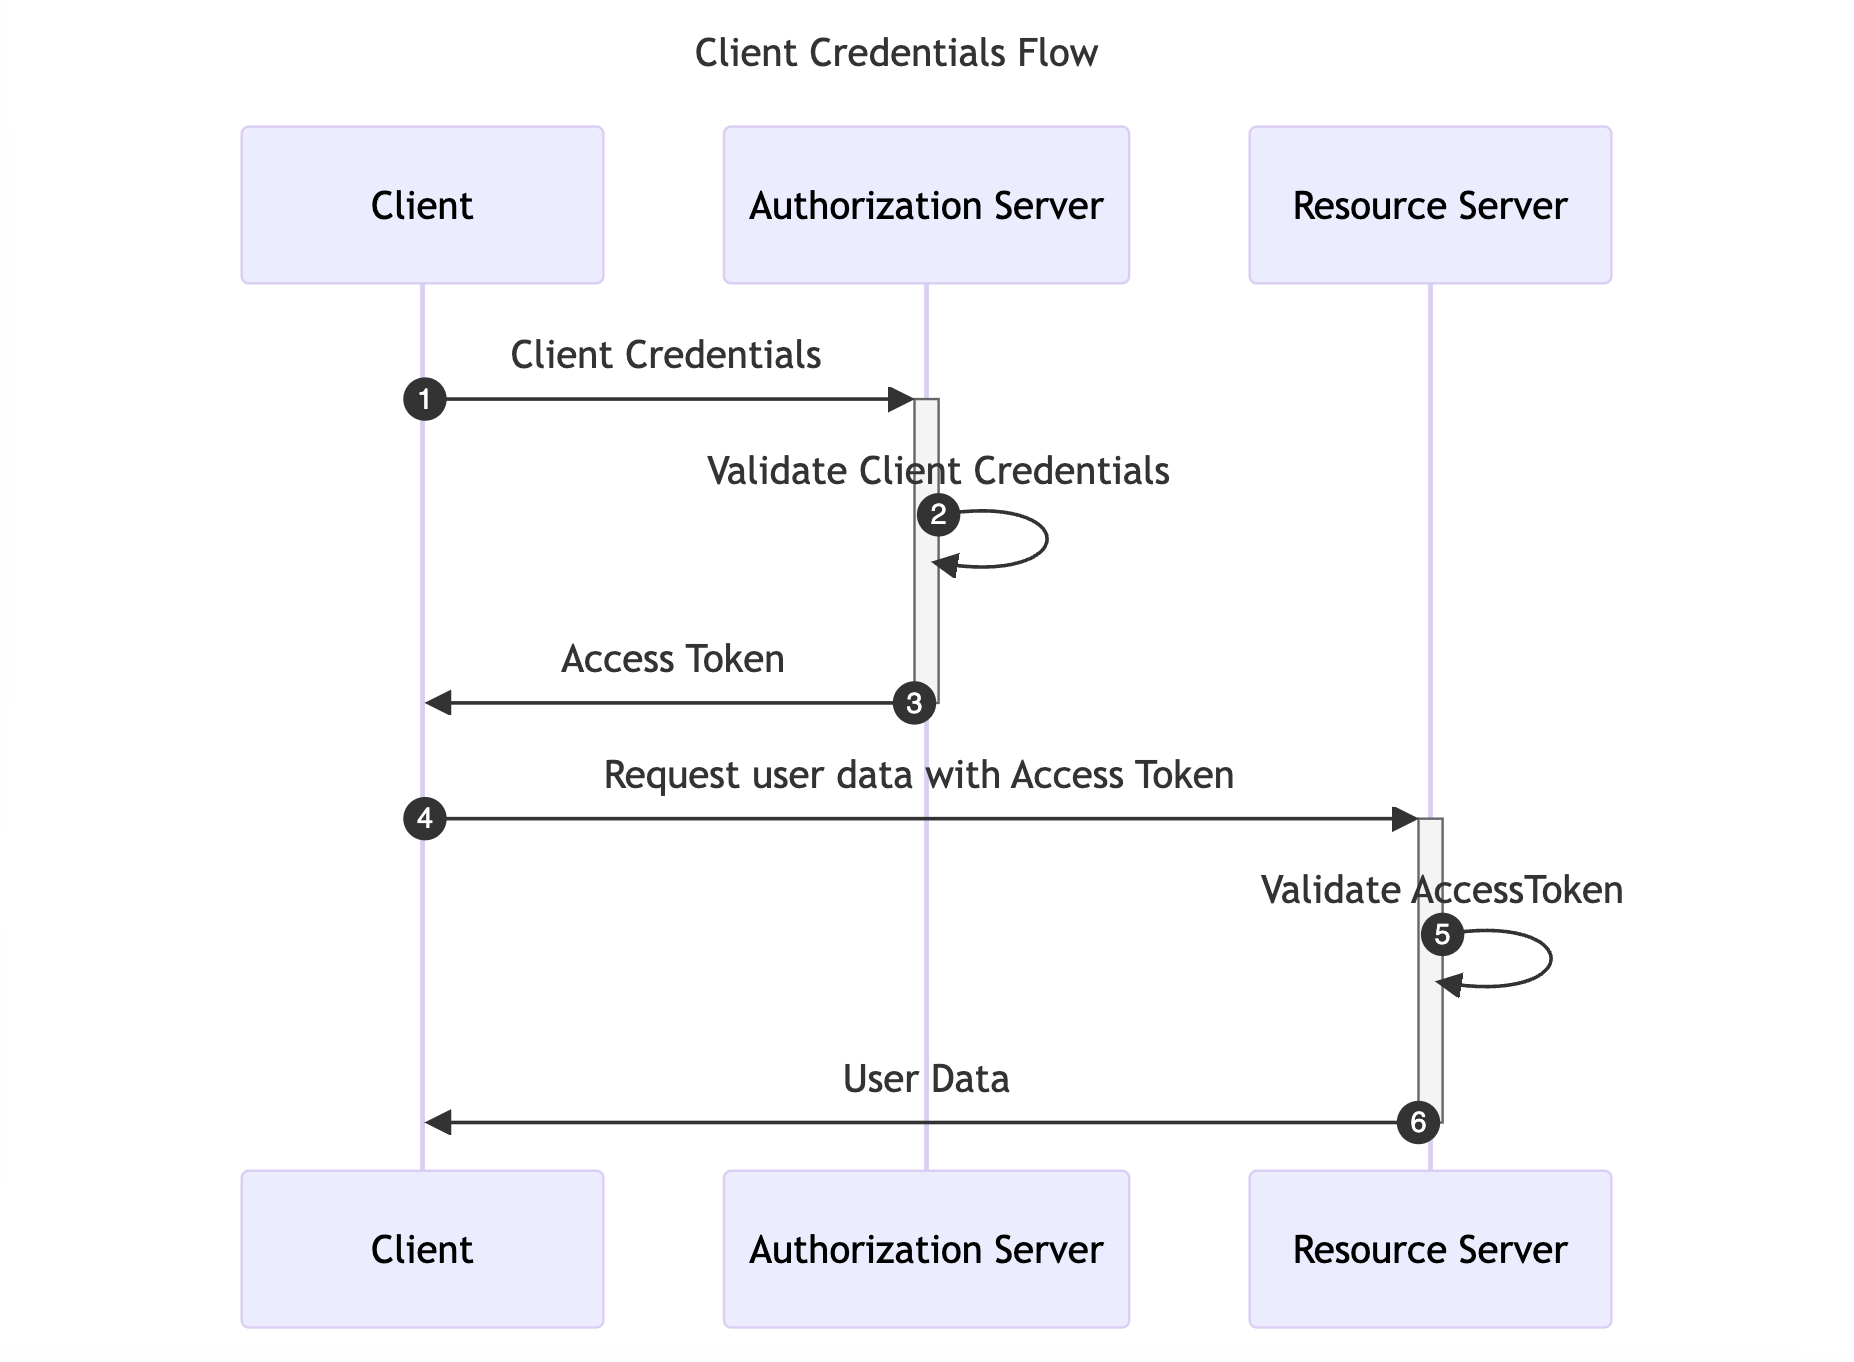
The Client Credentials Flow is designed for Machine-to-Machine (M2M) applications, such as daemons or backend services. It is useful when the Client is also the Resource Owner, eliminating the need for User Agent authentication. This flow allows the Client to directly retrieve an Access Token by providing the Client Credentials.
The diagram below illustrates the Client Credentials Flow:
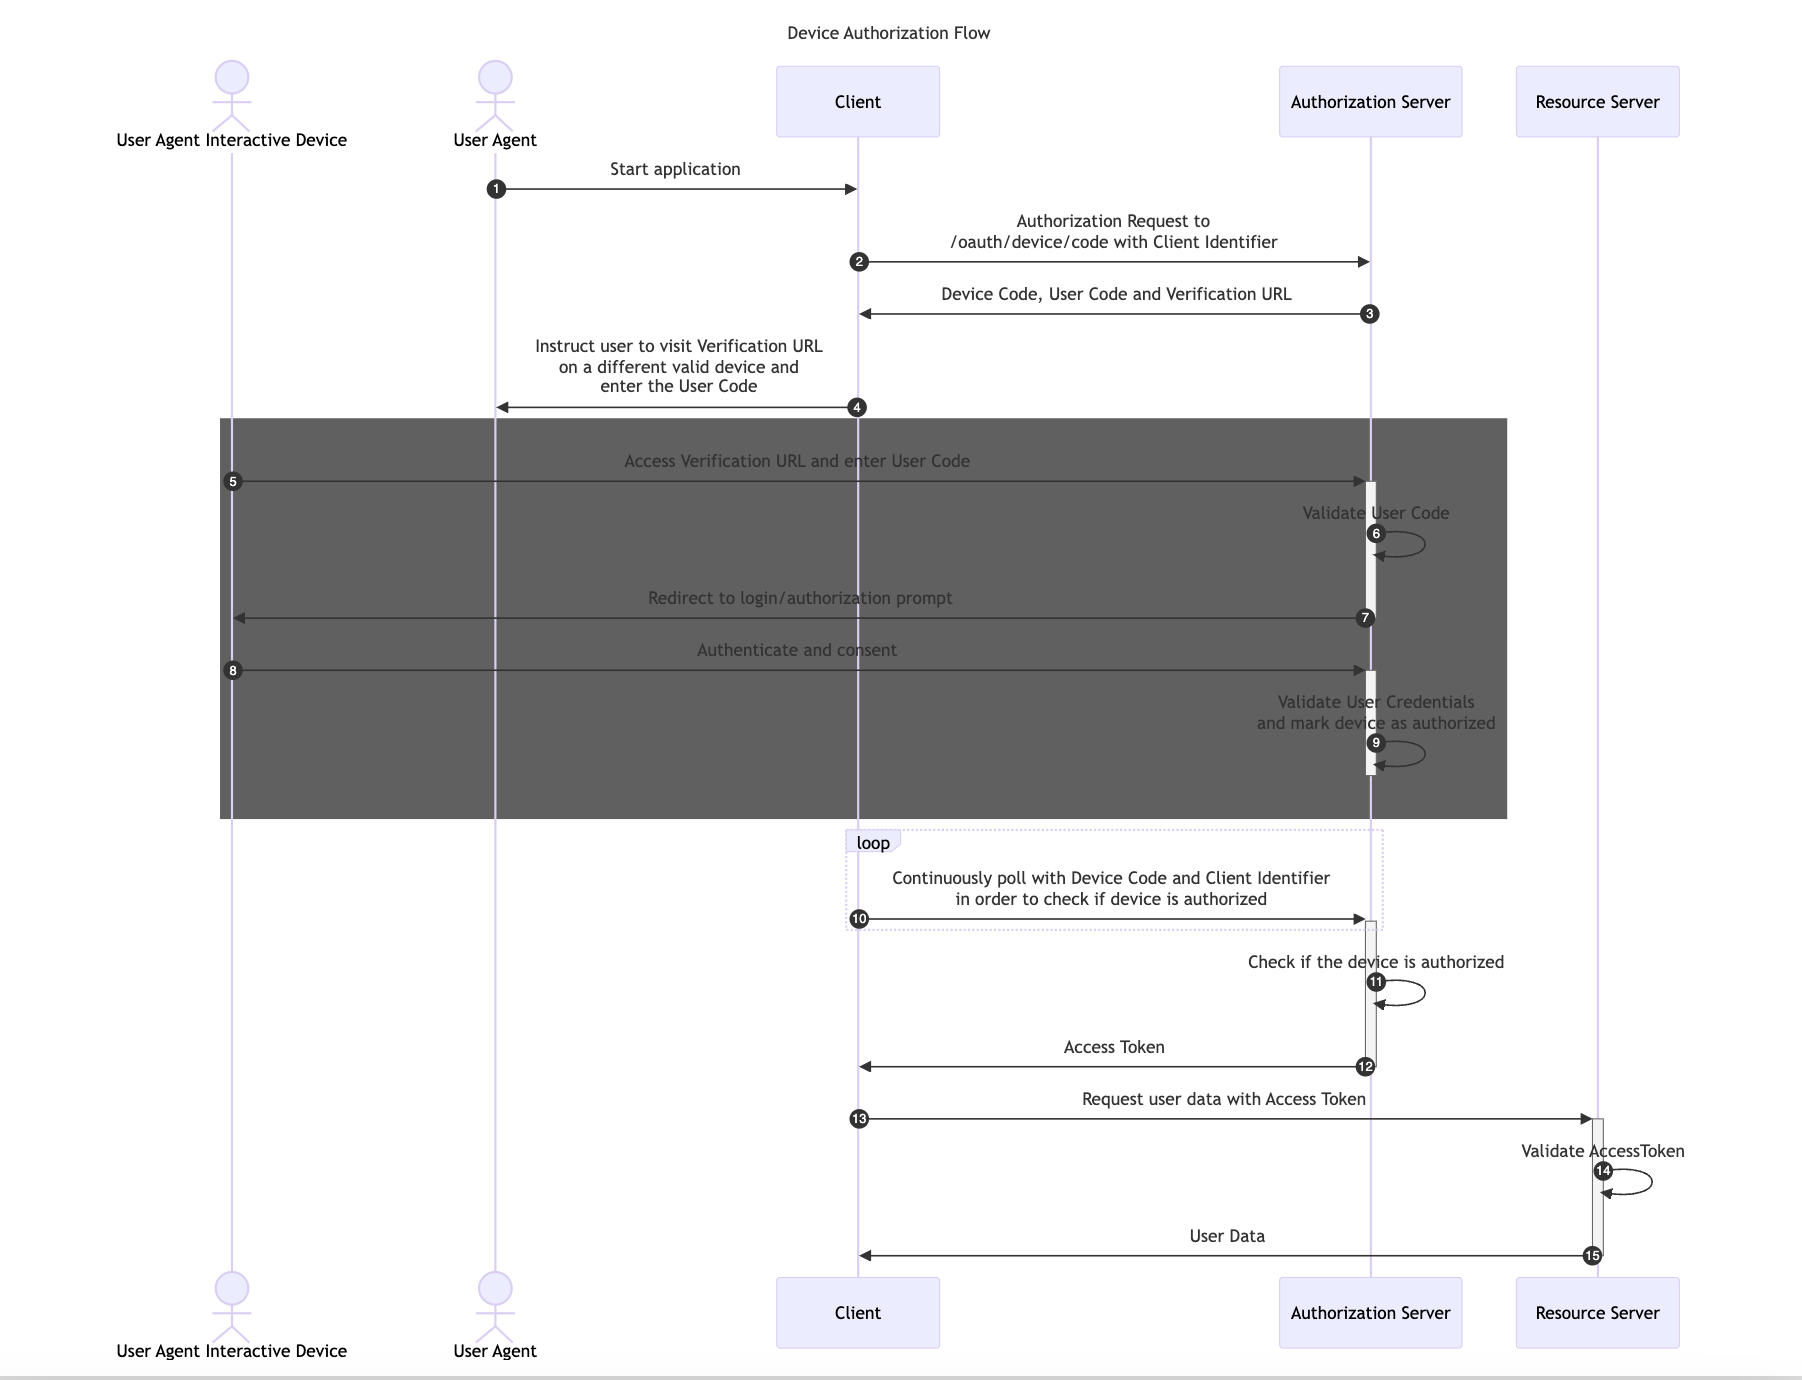
The Device Authorization Flow is designed for Internet-connected devices that either lack a browser for user-agent-based authorization or are too input-constrained to make text-based authentication practical during the authorization flow.
This flow allows OAuth Clients on devices such as smart TVs, media consoles, digital picture frames or printer to obtain user authorization to access protected resources using a User Agent on a separate device.
In this flow, first the Client application retrieves a User Code and Verification URL from the Authorization Server. Then, it instructs the User Agent to Authenticate and Consent with a different device using the provided User Code and Verification URL.
The following image illustrates the Device Authorization Code Flow:
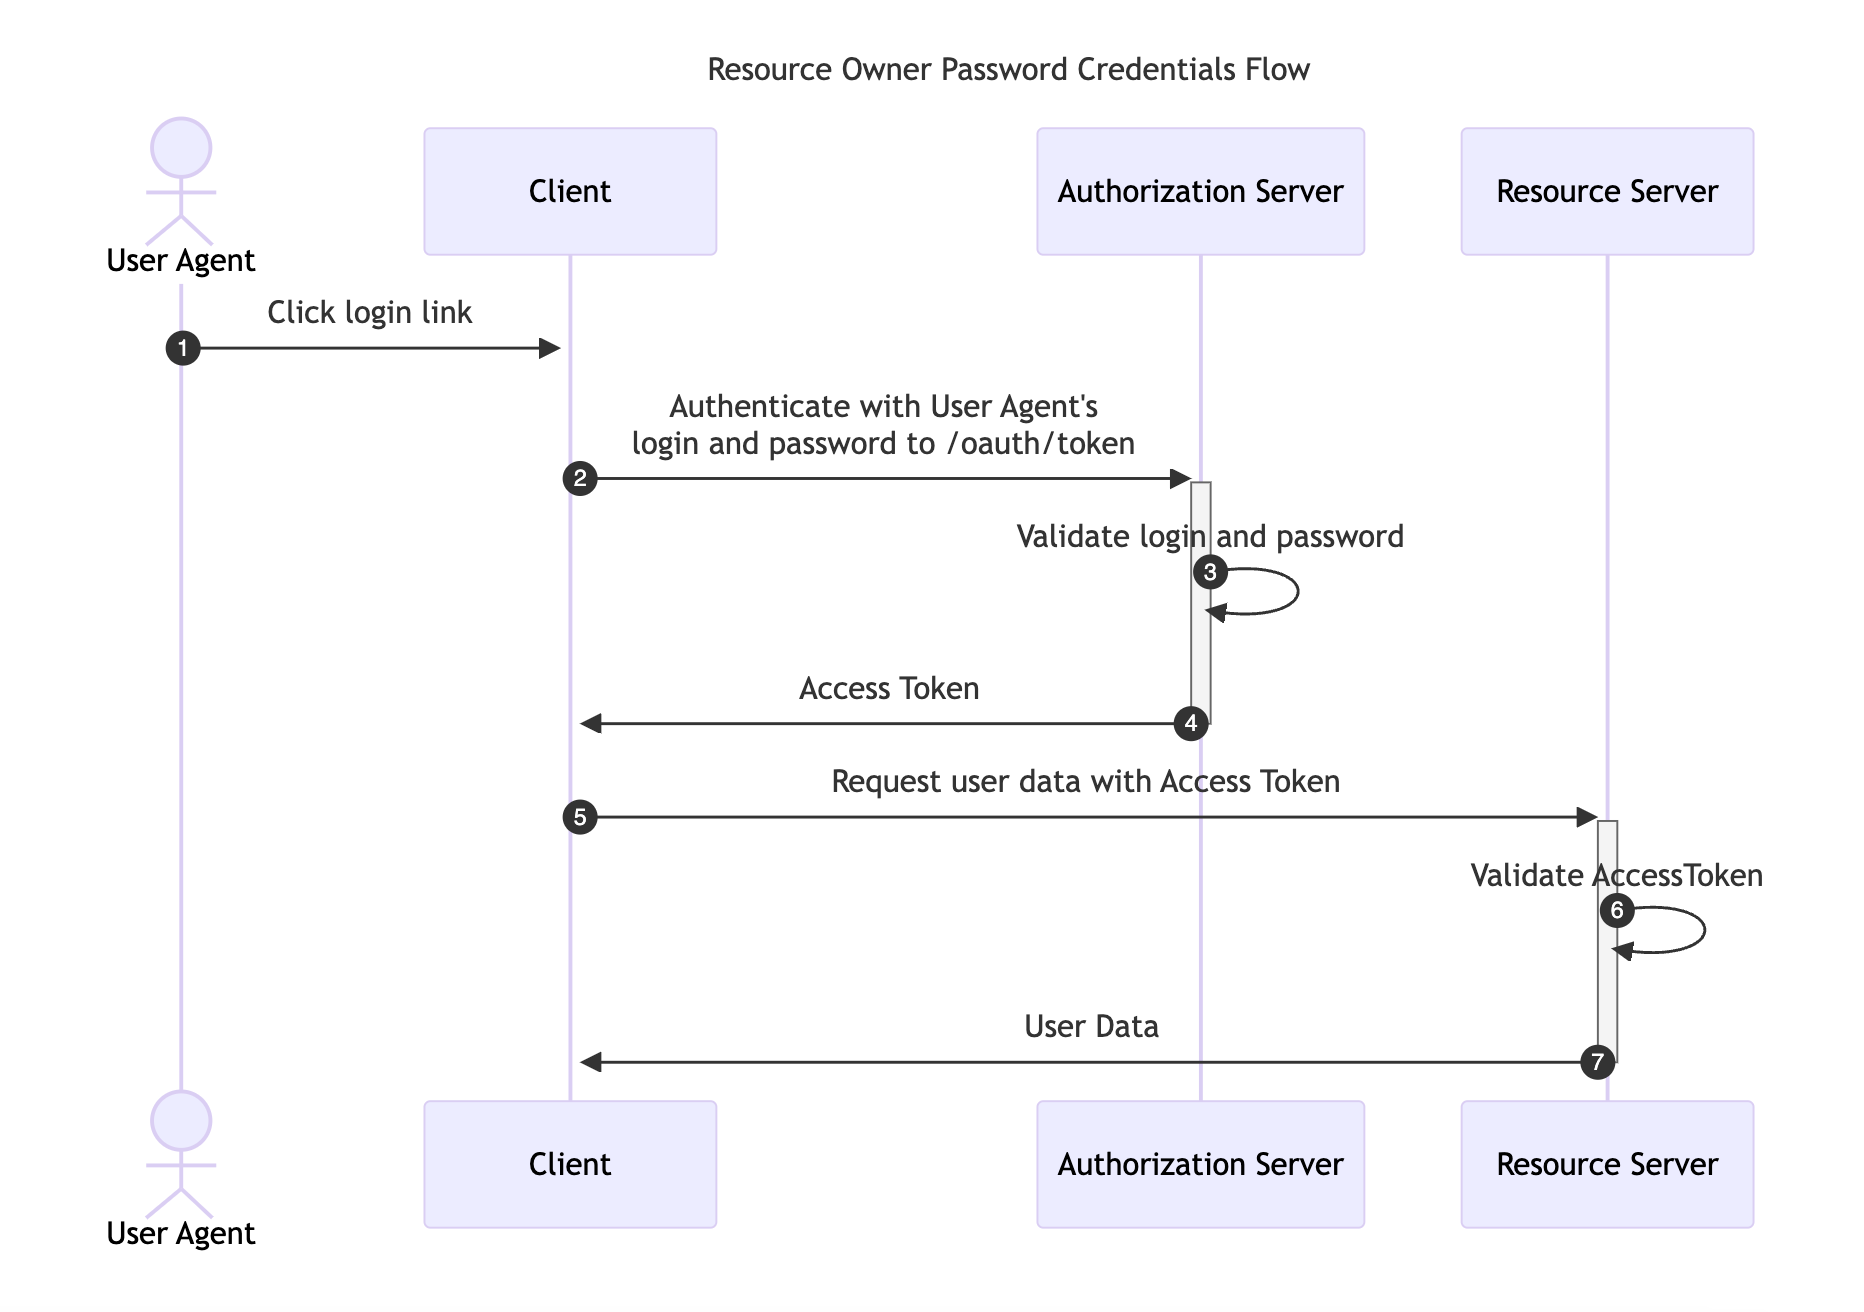
This flow requires the Resource Owner to fully trust the Client with their credentials to the Authorization Server. It was designed for use-cases when redirect-based flows cannot be used, although, it has been removed in the recent OAuth 2.1 RFC specification and its use is not recommended.
Instead of redirecting the Resource Owner to the Authorization Server, the user credentials are sent to the Client application, which then forwards them to the Authorization Server.
The following image illustrates the Resource Owner Password Credentials Flow:
In this section we’ll present common attacks against OAuth with basic remediation strategies.
OAuth CSRF is an attack against OAuth flows, where the browser consuming the authorization code is different than the one that has initiated the flow. It can be used by an attacker to coerce the victim to consume their Authorization Code, causing the victim to connect with attacker’s authorization context.
Consider the following diagram:

Depending on the context of the application, the impact can vary from low to high. In either case it is vital to ensure that user has the control of which authorization context they operate in and cannot be coerced into another one.
OAuth specification recommends to utilize the state parameter to prevent CSRF attacks.
[state is] an opaque value used by the client to maintain state between the request and callback. The authorization server includes this value when redirecting the user-agent back to the client. The parameter SHOULD be used for preventing cross-site request forgery (CSRF).
The following scheme illustrates how the state parameter can prevents the attack:

Well implemented Authorization Servers validate the redirect_uri parameter before redirecting the User Agent back to the Client. The allowlist of redirect_uri values should be configured per-client. Such design ensures that the User Agent can only be redirected to the Client and the Authorization Code will be only disclosed to the given Client. Conversely, if the Authorization Server neglects or misimplements this verification, a malicious actor can manipulate a victim to complete a flow that will disclose their Authorization Code to an untrusted party.
In the simplest form, when redirect_uri validation is missing altogether, exploitation can be illustrated with the following flow:

This vulnerability can also emerge when validation is inadequately implemented. The only proper way is validation by comparing the exact redirect_uri including both the origin (scheme, hostname, port) and the path.
Common mistakes include:
If the given origin includes a URL with an open redirect vulnerability, or pages with user-controlled content, they can abused to steal the code through the Referer header, or through the open redirect.
On the other hand, the following overlooks:
may lead to various bypasses by crafting a malicious URLs, that will lead to an untrusted origins.
According to the OAuth specification, users are uniquely identified by the sub field. However there is no standard format of this field. As a result, many different formats are used, depending on the Authorization Server. Some of the Client applications, in an effort to craft a uniform way of identifying users across multiple Authorization Servers, fall back to user handles, or emails. However this approach may be dangerous, depending on the Authorization Server used. Some of the Authorization Servers do not guarantee immutability for such user properties. Even worse so, in some cases these properties can be arbitrarily changed by the users themselves. In such cases account takeovers might be possible.
One of such cases emerges, when the feature “Login with Microsoft” is implemented to use the email field to identify users.. In such cases, an attacker might create their own AD organization (doyensectestorg in this case) on Azure, which can be used then to to perform “Login with Microsoft”. While the Object ID field, which is placed in sub, is immutable for a given user and cannot be spoofed, the email field is purely user-controlled and does not require any verification.
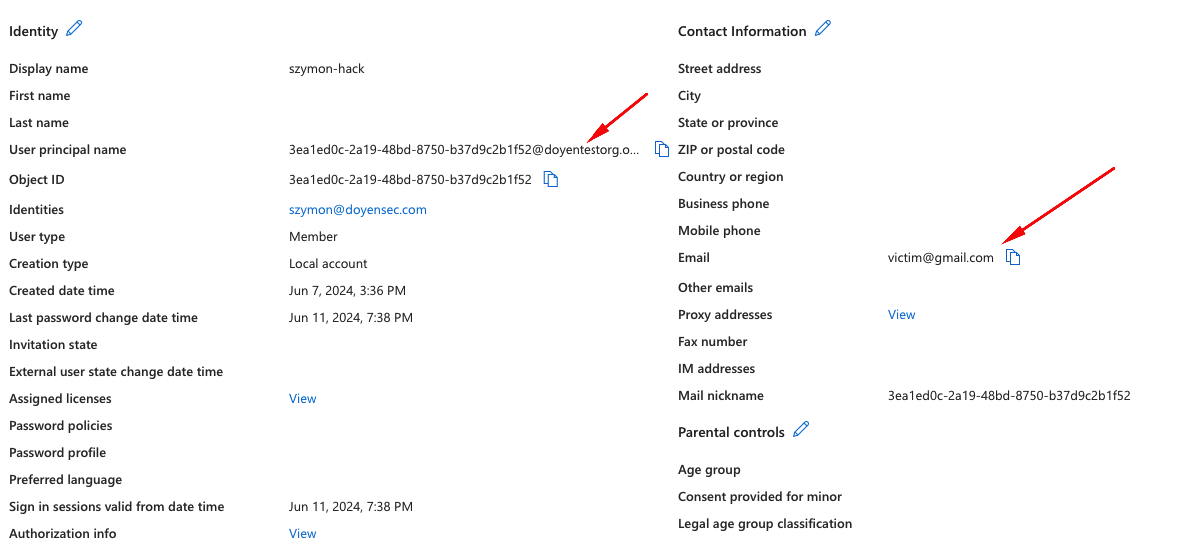
In the screenshot above, there’s an example user created, that could be used to take over an account victim@gmail.com in the Client, which uses the email field for user identification.
When applications implement OAuth Implicit Flow for authentication they should verify that the final provided token was generated for that specific Client ID. If this check is not performed, it would be possible for an attacker to use an Access Token that had been generated for a different Client ID.
Imagine the attacker creates a public website which allows users to log in with Google’s OAuth Implicit flow. Assuming thousands of people connect to the hosted website, the attacker would then have access to their Google’s OAuth Access Tokens generated for the attacker website.
If any of these users already had an account on a vulnerable website that does not verify the Access Token, the attacker would be able to provide the victim’s Access Token generated for a different Client ID and will be able to take over the account of the victim.
A secure OAuth Implicit Flow implemented for authentication would be as follows:

If steps 8 to 10 are not performed and the token’s Client ID is not validated, it would be possible to perform the following attack:

It is worth noting, that even if the Client uses a more secure flow (e.g. Explicit Flow), it might accept Access Tokens - effectively allowing a downgrade to the Implicit Flow. Additionally, if the application uses the Access Tokens as session cookies or authorization headers it might be vulnerable. In practice, ensuring that the Access Tokens are never accepted from user-controlled parameters breaks the exploitation chain early. On top of that we recommend performing token verification as described above in steps 8 to 10.
With the Authorization Code Grant type, the user’s data is requested and sent via secure server-to-server communication.
If the Authorization Server accepts and implicitly trusts a scope parameter sent in the Access Token Request (Note this parameter is not specified in the RFC for the Access Token Request in the Authorization Code Flow), a malicious application could try to upgrade the scope of Authorization Codes retrieved from user callbacks by sending a higher privileged scope in the Access Token Request.
Once the Access Token is generated, the Resource Server must verify the Access Token for every request. This verification depends on the Access Token format, the commonly used ones are the following:
client_id, scope, etc.)

Following the RFC guidelines, the scope parameter should not be sent in the Access Token Request in the Authorization Code flow, although it can be specified in other flows such as the Resource Owner Password Credentials Grant.
The Authorization Server should either ignore the scope parameter or verify it matches the previous scope provided in the Authorization Request.
When the need to use OAuth on mobile arises, the mobile application takes the role of OAuth User Agents. In order for them to be able to receive the redirect with Authorization Code developers often rely on the mechanism of custom schemes. However, multiple applications can register given scheme on a given device. This breaks OAuth’s assumption that the Client is the only one to control the configured redirect_uri and may lead to Authorization Code takeover in case a malicious app is installed in victim’s devices.
Android Intent URIs have the following structure:
<scheme>://<host>:<port>[<path>|<pathPrefix>|<pathPattern>|<pathAdvancedPattern>|<pathSuffix>]
So for instance the following URI com.example.app://oauth depicts an Intent with scheme=com.example.app and host=oauth. In order to receive these Intents an Android application would need to export an Activity similar to the following:
    <intent-filter>
        <action android:name="android.intent.action.VIEW"/>
        <category android:name="android.intent.category.DEFAULT"/>
        <category android:name="android.intent.category.BROWSABLE"/>
        <data android:host="oauth" android:scheme="=com.example.app"/>
    </intent-filter>
Android system is pretty lenient when it comes to defining Intent Filters. The less filter details, the wider net and more potential URIs caught. So for instance if only scheme is provided, all Intents for this scheme will be caught, regardless of there host, path, etc.
If there are more than one applications that can potentially catch given Intent, they system will let the user decide which to use, which means a redirect takeover would require user interaction. However with the above knowledge it is possible to try and create bypasses, depending on how the legitimate application’s filter has been created. Paradoxically, the more specific original developers were, the easier it is to craft a bypass and take over the redirect without user interaction. In detail, Ostorlab has created the following flowchart to quickly assess whether it is possible:

For situations where the Explicit Authorization Code Flow is not viable, because the Client cannot be trusted to securely store the Client Secret, Authorization Code Flow with Proof Key for Code Exchange (PKCE) has been created. We recommend utilizing this flow for authorizing mobile applications.
Additionally, to restore the trust relation between the Authorization Server and redirect_uri target, it is recommended to use Android’s Verifiable Links and iOS’s Associated Domains mechanisms.
In short, Android’s announced autoVerify property for Intent Filters. In detail, developers can create an Intent Filter similar to the following:
<intent-filter android:autoVerify="true">
  <action android:name="android.intent.action.VIEW" />
  <category android:name="android.intent.category.DEFAULT" />
  <category android:name="android.intent.category.BROWSABLE" />
  <data android:scheme="http" />
  <data android:scheme="https" />
  <data android:host="www.example.com" />
</intent-filter>
When the Intent Filter is defined in the above way, the Android system verifies whether the defined host is actually owned by the creator of the app. In detail, the host needs to publish a /.well-known/assetlinks.json file to the associated domain, listing the given APK, in order for it to be allowed to handle given links:
[{
  "relation": ["delegate_permission/common.handle_all_urls"],
  "target": {
    "namespace": "android_app",
    "package_name": "com.example",
    "sha256_cert_fingerprints":
    ["14:6D:E9:83:C5:73:06:50:D8:EE:B9:95:2F:34:FC:64:16:A0:83:42:E6:1D:BE:A8:8A:04:96:B2:3F:CF:44:E5"]
  }
}]
Thanks to this design, rogue applications cannot register their own Intent Filter for the already claimed host, although this would only work if the handled scheme is not custom. For instance, if the application handles the com.example.app:// scheme there is no way to give additional priority and the user will have to choose between the apps that implement a handler for that specific scheme.
This article provides a comprehensive list of attacks and defenses for the OAuth protocol. Along with the post itself, we are releasing a comprehensive cheat-sheet for developers and testers.
Download the OAuth Security Cheat Sheet: Doyensec_OAuth_CheatSheet.pdf.
As this field is subject to frequent new research and development, we do not claim full knowledge of all intricacies. If you have suggestions on how to improve this summary, feel free to contact the authors. We would be glad to update this blog post so that it can be considered as a comprehensive resource for anyone interested in the topic.
In my previous blog post, I demonstrated how a JSON file could be used as a gadget for Client-Side Path Traversal (CSPT) to perform Cross-Site Request Forgery (CSRF). That example was straightforward because no file upload restriction was enforced. However, real-world applications often impose restrictions on file uploads to ensure security.
In this post, we’ll explore how to bypass some of these mechanisms to achieve the same goal. We’ll cover common file validation methods and how they can be subverted.
In most scenarios, the gadget file will be parsed in the front-end using JSON.parse.
It means that our file must be a valid input for JSON.parse.
If we look at the V8 implementation. A valid JSON input is :
The parser skips starting WHITESPACE characters such as :
Also, control characters and double quotes inside a JSON object (key or value) will break the JSON structure and must be escaped.
Our gadget file must follow these restrictions to be parsed as JSON.
Different applications validate files using libraries or tools designed to detect the file’s MIME type, file structure or magic bytes. By creatively crafting files that meet these conditions, we can fool these validations and bypass the restrictions.
Let’s explore how various file upload mechanisms can be bypassed to maintain valid JSON payloads for CSPT while satisfying file format requirements, such as PDFs or images.
A basic check in many upload mechanisms involves verifying the file’s MIME type. This is often done using the Content-Type header or by inspecting the file itself. However, these checks can often be bypassed by manipulating the file’s structure or headers.
The mmmagic library is commonly used in Node.js applications to detect file types based on the Magic database. A PDF file can be verified with the following code:
async function checkMMMagic(binaryFile) {
    var magic = new Magic(mmm.MAGIC_MIME_TYPE);

    const detectAsync = (binaryFile) => {
        return new Promise((resolve, reject) => {
            magic.detect.call(magic, binaryFile, (error, result) => {
                if (error) {
                    reject(error);
                } else {
                    resolve(result);
                }
            });
        });
    };

    const result = await detectAsync(binaryFile);

    const isValid = (result === 'application/pdf')
    if (!isValid) {
        throw new Error('mmmagic: File is not a PDF : ' + result);
    }
}
The library checks for the %PDF magic bytes. It uses the Magic detection rules defined here. However, according to the PDF specification, this magic number doesn’t need to be at the very beginning of the file.
We can wrap a PDF header within the first 1024 bytes of a JSON object. It will be a valid JSON file considered as a PDF by the library. This allows us to fool the library into accepting the upload as a valid PDF while still allowing it to be parsed as JSON by the browser. Here’s an example:
{ "id" : "../CSPT_PAYLOAD", "%PDF": "1.4" }
As long as the %PDF header appears within the first 1024 bytes, the mmmagic library will accept this file as a PDF, but it can still be parsed as JSON on the client side.
The pdflib library requires more than just the %PDF header. It can be used to validate the overall PDF structure.
async function checkPdfLib(binaryFile) {
    let pdfDoc = null
    try {
        pdfDoc = await PDFDocument.load(binaryFile);
    } catch (error) {
        throw new Error('pdflib: Not a valid PDF')
    }

    if (pdfDoc.getPageCount() == 0) {
        throw new Error('pdflib: PDF doesn\'t have a page');
    }
}
To bypass this, we can create a valid PDF (for pdflib) that still conforms to the JSON structure required for CSPT.
The trick is to replace %0A (line feed) characters between PDF object definitions with space %20. This allows the file to be recognized as a valid PDF for pdflib but still be interpretable as JSON. The xref table doesn’t need to be fixed because our goal is not to display the PDF, but to pass the upload validation.
Here’s an example:
{"_id":"../../../../CSPT?","bypass":"%PDF-1.3 1 0 obj << /Pages 2 0 R /Type /Catalog >> endobj 2 0 obj << /Count 1 /Kids [ 3 0 R ] /Type /Pages >> endobj 3 0 obj << /Contents 4 0 R /MediaBox [ 0 0 200 200 ] /Parent 2 0 R /Resources << /Font << /F1 5 0 R >> >> /Type /Page >> endobj 4 0 obj << /Length 50 >> stream BT /F1 10 Tf 20 100 Td (CSPT) Tj ET endstream endobj 5 0 obj << /Type /Font /Subtype /Type1 /BaseFont /Helvetica >> endobj xref 0 6 0000000000 65535 f 0000000009 00000 n 0000000062 00000 n 0000000133 00000 n 0000000277 00000 n 0000000370 00000 n trailer << /Size 6 /Root 1 0 R >> startxref 447 %%EOF "}
While this PDF will not render in recent PDF viewers, it will be readable by pdflib and pass the file upload checks.
In some environments, the file command or a library based on file is used to detect file types.
async function checkFileCommand(binaryFile) {
    //Write a temporary file
    const tmpobj = tmp.fileSync();
    fs.writeSync(tmpobj.fd, binaryFile);
    fs.closeSync(tmpobj.fd);

    // Exec file command
    output = execFileSync('file', ["-b", "--mime-type", tmpobj.name])

    const isValid = (output.toString() === 'application/pdf\n')
    if (!isValid) {
        throw new Error(`content - type: File is not a PDF : ${output}`);
    }
    tmpobj.removeCallback();

}
The difference with mmmagic is that before checking the magic bytes, it tries to parse the file as JSON. If it succeed, the file is considered to be JSON and no other checks will be perform. So we can’t use the same trick as mmmagic. However, the file command has a known limit on the size of files it can process. This is an extract of the man file command.
     -P, --parameter name=value
             Set various parameter limits.

            Name         Default    Explanation
            bytes        1048576    max number of bytes to read from file
            elf_notes    256        max ELF notes processed
            elf_phnum    2048       max ELF program sections processed
            elf_shnum    32768      max ELF sections processed
            encoding     65536      max number of bytes for encoding evaluation
            indir        50         recursion limit for indirect magic
            name         60         use count limit for name/use magic
            regex        8192       length limit for regex searches
We can see a limit on the number of bytes to read. We can exploit this limit by padding the file with whitespace characters (such as spaces or tabs) until the file exceeds the parsing limit. Once the limit is reached, the file_is_json function will fail, and the file will be classified as a different file type (e.g., a PDF).
For example, we can create a file like this:
{
  "_id": "../../../../CSPT?",
  "bypass": "%PDF-1.3 1 0 obj <<   /Pages 2 0 R   /Type /Catalog >> endobj 2 0 obj <<   /Count 1   /Kids [     3 0 R   ]   /Type /Pages >> endobj 3 0 obj <<   /Contents 4 0 R   /MediaBox [ 0 0 200 200 ]   /Parent 2 0 R   /Resources <<     /Font << /F1 5 0 R >>   >>   /Type /Page >> endobj 4 0 obj <<   /Length 50 >> stream BT   /F1 10 Tf   20 100 Td   (CSPT) Tj ET endstream endobj 5 0 obj <<   /Type /Font   /Subtype /Type1   /BaseFont /Helvetica >> endobj xref 0 6 0000000000 65535 f 0000000009 00000 n 0000000062 00000 n 0000000133 00000 n 0000000277 00000 n 0000000370 00000 n trailer <<   /Size 6   /Root 1 0 R >> startxref 447 %%EOF <..A LOT OF SPACES..> "
}
When uploaded, the file command will be unable to parse this large JSON structure, causing it to fall back to normal file detection and to treat the file as a PDF.
Image uploads often use libraries like file-type to validate file formats. The following code tries ensure that the uploaded file is an image.
const checkFileType = async (binary) => {
    const { fileTypeFromBuffer } = await fileType();

    const type = await fileTypeFromBuffer(binary);
    const result = type.mime;

    const isValid = result.startsWith('image/');
    if (!isValid) {
        throw new Error('file-type: File is not an image : ' + result);
    }
};
Sometimes, these libraries check for specific magic numbers at a predefined offset. In this example, file-type checks if the magic bytes are present at offset 8:
https://github.com/sindresorhus/file-type/blob/v19.6.0/core.js#L358C1-L363C1
if (this.checkString('WEBP', {offset: 8})) {
  return {
    ext: 'webp',
    mime: 'image/webp',
  };
}
As we have control over the starting bytes, we can build a valid JSON file. We can craft a JSON object that places the magic bytes (WEBP) at the correct offset, allowing the file to pass validation as an image while still being a valid JSON object. Here’s an example:
{"aaa":"WEBP","_id":"../../../../CSPT?"}
This file will pass the file-type check for images, while still containing JSON data that can be used for CSPT.
Bypassing file-upload restrictions is not new but we wanted to share some methods we used in past years to upload JSON gadgets when file-upload restrictions are implemented. We used them in order to perform CSPT2CSRF or any other exploits (XSS, etc.) but they can be applied in other contexts too. Don’t hesitate to dig into third-party source code in order to understand how it works.
All these examples and files have been included in our CSPTPlayground. The playground doesn’t only include CSPT2CSRF but also other examples such as a JSONP gadget or Open Redirect. This was built based on feedback received by Isira Adithya (@isira_adithya) and Justin Gardner (@Rhynorater). Thank you so much!
If you would like to learn more about our other research, check out our blog, follow us on X (@doyensec) or feel free to contact us at info@doyensec.com for more information on how we can help your organization “Build with Security”.
At Doyensec, we decided to perform a vulnerability research activity on the SMB3 Kernel Server (ksmbd), a component of the Linux kernel. Initially, it was enabled as an experimental feature, but in the kernel version 6.6, the experimental flag was removed, and it remains stable.
Ksmbd splits tasks to optimize performance, handling critical file operations in kernel space and non-performance-related tasks, such as DCE/RPC and user account management, in user space via ksmbd.mountd. The server uses a multi-threaded architecture to efficiently process SMB requests in parallel, leveraging kernel worker threads for scalability and user-space integration for configuration and RPC handling.
Ksmbd is not enabled by default, but it is a great target for learning the SMB protocol while also exploring Linux internals, such as networking, memory management, and threading.
The ksmbd kernel component binds directly to port 445 to handle SMB traffic. Communication between the kernel and the ksmbd.mountd user-space process occurs via the Netlink interface, a socket-based mechanism for kernel-to-user space communication in Linux. We focused on targeting the kernel directly due to its direct reachability, even though ksmbd.mountd operates with root privileges.
The illustrative diagram of the architecture can be found here in the mailing list and is displayed below:
               |--- ...
       --------|--- ksmbd/3 - Client 3
       |-------|--- ksmbd/2 - Client 2
       |       |         ____________________________________________________
       |       |        |- Client 1                                          |
<--- Socket ---|--- ksmbd/1   <<= Authentication : NTLM/NTLM2, Kerberos      |
       |       |      | |     <<= SMB engine : SMB2, SMB2.1, SMB3, SMB3.0.2, |
       |       |      | |                SMB3.1.1                            |
       |       |      | |____________________________________________________|
       |       |      |
       |       |      |--- VFS --- Local Filesystem
       |       |
KERNEL |--- ksmbd/0(forker kthread)
---------------||---------------------------------------------------------------
USER           ||
               || communication using NETLINK
               ||  ______________________________________________
               || |                                              |
        ksmbd.mountd <<= DCE/RPC(srvsvc, wkssvc, samr, lsarpc)   |
               ^  |  <<= configure shares setting, user accounts |
               |  |______________________________________________|
               |
               |------ smb.conf(config file)
               |
               |------ ksmbdpwd.db(user account/password file)
                            ^
  ksmbd.adduser ------------|
Multiple studies on this topic have been published, including those by Thalium and pwning.tech. The latter contains a detailed explanation on how to approach fuzzing from scratch using syzkaller. Although the article’s grammar is quite simple, it provides an excellent starting point for further improvements we built upon.
We began by intercepting and analyzing legitimate communication using a standard SMB client. This allowed us to extend the syzkaller grammar to include additional commands implemented in smb2pdu.c.
During fuzzing, we encountered several challenges, one of which was addressed in the pwning.tech article. Initially, we needed to tag packets to identify the syzkaller instance (procid). This tagging was required only for the first packet, as subsequent packets shared the same socket connection. To solve this, we modified the first (negotiation) request by appending 8 bytes representing the syzkaller instance number. Afterward, we sent subsequent packets without tagging.
Another limitation of syzkaller is its inability to use malloc() for dynamic memory allocation, complicating the implementation of authentication in pseudo syscalls. To work around this, we patched the relevant authentication (NTLMv2) and packet signature verification checks, allowing us to bypass negotiation and session setup without valid signatures. This enabled the invocation of additional commands, such as ioctl processing logic.
To create more diverse and valid test cases, we initially extracted communication using strace, or manually crafted packets. For this, we used Kaitai Struct, either through its web interface or visualizer. When a packet was rejected by the kernel, Kaitai allowed us to quickly identify and resolve the issue.
During our research, we identified multiple security issues, three of which are described in this post. These vulnerabilities share a common trait - they can be exploited without authentication during the session setup phase. Exploiting them requires a basic understanding of the communication process.
During KSMBD initialization (whether built into the kernel or as an external module), the startup function create_socket() is called to listen for incoming traffic:
// https://elixir.bootlin.com/linux/v6.11/source/fs/smb/server/transport_tcp.c#L484
	ret = kernel_listen(ksmbd_socket, KSMBD_SOCKET_BACKLOG);
	if (ret) {
		pr_err("Port listen() error: %d\n", ret);
		goto out_error;
	}
The actual data handling occurs in the ksmbd_tcp_new_connection() function and the spawned per-connection threads (ksmbd:%u). This function also allocates the struct ksmbd_conn, representing the connection:
// https://elixir.bootlin.com/linux/v6.11/source/fs/smb/server/transport_tcp.c#L203
static int ksmbd_tcp_new_connection(struct socket *client_sk)
{
	// ..
	handler = kthread_run(ksmbd_conn_handler_loop,
			      KSMBD_TRANS(t)->conn,
			      "ksmbd:%u",
			      ksmbd_tcp_get_port(csin));
	// ..
}
The ksmbd_conn_handler_loop is crucial as it handles reading, validating and processing SMB protocol messages (PDUs). In the case where there are no errors, it calls one of the more specific processing functions:
// https://elixir.bootlin.com/linux/v6.11/source/fs/smb/server/connection.c#L395
		if (default_conn_ops.process_fn(conn)) {
			pr_err("Cannot handle request\n");
			break;
		}
The processing function adds a SMB request to the worker thread queue:
// ksmbd_server_process_request
static int ksmbd_server_process_request(struct ksmbd_conn *conn)
{
	return queue_ksmbd_work(conn);
}
This occurs inside queue_ksmbd_work, which allocates the ksmbd_work structure that wraps the session, connection, and all SMB-related data, while also performing early initialization.
In the Linux kernel, adding a work item to a workqueue requires initializing it with the INIT_WORK() macro, which links the item to a callback function to be executed when processed. Here, this is performed as follows:
// https://elixir.bootlin.com/linux/v6.11/source/fs/smb/server/server.c#L312
	INIT_WORK(&work->work, handle_ksmbd_work);
	ksmbd_queue_work(work);
We are now close to processing SMB PDU operations. The final step is for handle_ksmbd_work to extract the command number from the request
// https://elixir.bootlin.com/linux/v6.11/source/fs/smb/server/server.c#L213
rc = __process_request(work, conn, &command);
and execute the associated command handler.
// https://elixir.bootlin.com/linux/v6.11/source/fs/smb/server/server.c#L108
static int __process_request(struct ksmbd_work *work, struct ksmbd_conn *conn,
			     u16 *cmd)
{
	// ..
	command = conn->ops->get_cmd_val(work);
	*cmd = command;
	// ..

	cmds = &conn->cmds[command];
	// ..
	ret = cmds->proc(work);
Here is the list of the procedures that are invoked:
// https://elixir.bootlin.com/linux/v6.11/source/fs/smb/server/smb2ops.c#L171
	[SMB2_NEGOTIATE_HE]	=	{ .proc = smb2_negotiate_request, },
	[SMB2_SESSION_SETUP_HE] =	{ .proc = smb2_sess_setup, },
	[SMB2_TREE_CONNECT_HE]  =	{ .proc = smb2_tree_connect,},
	[SMB2_TREE_DISCONNECT_HE]  =	{ .proc = smb2_tree_disconnect,},
	[SMB2_LOGOFF_HE]	=	{ .proc = smb2_session_logoff,},
	[SMB2_CREATE_HE]	=	{ .proc = smb2_open},
	[SMB2_QUERY_INFO_HE]	=	{ .proc = smb2_query_info},
	[SMB2_QUERY_DIRECTORY_HE] =	{ .proc = smb2_query_dir},
	[SMB2_CLOSE_HE]		=	{ .proc = smb2_close},
	[SMB2_ECHO_HE]		=	{ .proc = smb2_echo},
	[SMB2_SET_INFO_HE]      =       { .proc = smb2_set_info},
	[SMB2_READ_HE]		=	{ .proc = smb2_read},
	[SMB2_WRITE_HE]		=	{ .proc = smb2_write},
	[SMB2_FLUSH_HE]		=	{ .proc = smb2_flush},
	[SMB2_CANCEL_HE]	=	{ .proc = smb2_cancel},
	[SMB2_LOCK_HE]		=	{ .proc = smb2_lock},
	[SMB2_IOCTL_HE]		=	{ .proc = smb2_ioctl},
	[SMB2_OPLOCK_BREAK_HE]	=	{ .proc = smb2_oplock_break},
	[SMB2_CHANGE_NOTIFY_HE]	=	{ .proc = smb2_notify},
After explaining how the PDU function is reached, we can move on to discussing the resulting bugs.
The vulnerability stems from improper synchronization in the management of the sessions_table in ksmbd. Specifically, the code lacks a sessions_table_lock to protect concurrent access during both session expiration and session registration. This issue introduces a race condition, where multiple threads can access and modify the sessions_table simultaneously, leading to a Use-After-Free (UAF) in cache kmalloc-512.
The sessions_table is implemented as a hash table and it stores all active SMB sessions for a connection, using session identifier (sess->id) as the key.
During the session registration, the following flow happens:
ksmbd_expire_session to remove expired sessions to avoids stale sessions consuming resources.Operations on this table, such as adding (hash_add) and removing sessions (hash_del), lack proper synchronization, creating a race condition.
// https://elixir.bootlin.com/linux/v6.11/source/fs/smb/server/smb2pdu.c#L1663
int smb2_sess_setup(struct ksmbd_work *work)
{
	// ..
	ksmbd_conn_lock(conn);
	if (!req->hdr.SessionId) {
		sess = ksmbd_smb2_session_create(); // [1]
		if (!sess) {
			rc = -ENOMEM;
			goto out_err;
		}
		rsp->hdr.SessionId = cpu_to_le64(sess->id);
		rc = ksmbd_session_register(conn, sess); // [2]
		if (rc)
			goto out_err;

		conn->binding = false;
At [1], the session is created, by allocating the sess object:
// https://elixir.bootlin.com/linux/v6.11/source/fs/smb/server/mgmt/user_session.c#L381
	sess = kzalloc(sizeof(struct ksmbd_session), GFP_KERNEL);
	if (!sess)
		return NULL;
At this point, during a larger number of simultaneous connections, some sessions can expire. As the ksmbd_session_register at [2] is invoked, it calls ksmbd_expire_session [3]:
// https://elixir.bootlin.com/linux/v6.11/source/fs/smb/server/mgmt/user_session.c#L192
int ksmbd_session_register(struct ksmbd_conn *conn,
			   struct ksmbd_session *sess)
{
	sess->dialect = conn->dialect;
	memcpy(sess->ClientGUID, conn->ClientGUID, SMB2_CLIENT_GUID_SIZE);
	ksmbd_expire_session(conn); // [3]
	return xa_err(xa_store(&conn->sessions, sess->id, sess, GFP_KERNEL));
}
Since there is no table locking implemented, the expired sess object could be removed from the table ([4]) and deallocated ([5]):
// https://elixir.bootlin.com/linux/v6.11/source/fs/smb/server/mgmt/user_session.c#L173
static void ksmbd_expire_session(struct ksmbd_conn *conn)
{
	unsigned long id;
	struct ksmbd_session *sess;

	down_write(&conn->session_lock);
	xa_for_each(&conn->sessions, id, sess) {
		if (atomic_read(&sess->refcnt) == 0 &&
		    (sess->state != SMB2_SESSION_VALID ||
		     time_after(jiffies,
			       sess->last_active + SMB2_SESSION_TIMEOUT))) {
			xa_erase(&conn->sessions, sess->id);
			hash_del(&sess->hlist); // [4]
			ksmbd_session_destroy(sess); // [5]
			continue;
		}
	}
	up_write(&conn->session_lock);
}
However, in another thread, the cleanup could be invoked when the connection is terminated in ksmbd_server_terminate_conn by calling ksmbd_sessions_deregister, operating on the same table and without the appropriate lock ([6]):
// https://elixir.bootlin.com/linux/v6.11/source/fs/smb/server/mgmt/user_session.c#L213
void ksmbd_sessions_deregister(struct ksmbd_conn *conn)
{
	struct ksmbd_session *sess;
	unsigned long id;

	down_write(&sessions_table_lock);
	// .. ignored, since the connection is not binding
	up_write(&sessions_table_lock);

	down_write(&conn->session_lock);
	xa_for_each(&conn->sessions, id, sess) {
		unsigned long chann_id;
		struct channel *chann;

		xa_for_each(&sess->ksmbd_chann_list, chann_id, chann) {
			if (chann->conn != conn)
				ksmbd_conn_set_exiting(chann->conn);
		}

		ksmbd_chann_del(conn, sess);
		if (xa_empty(&sess->ksmbd_chann_list)) {
			xa_erase(&conn->sessions, sess->id);
			hash_del(&sess->hlist); // [6]
			ksmbd_session_destroy(sess);
		}
	}
	up_write(&conn->session_lock);
}
One possible flow is outlined here:
Thread A                         | Thread B
---------------------------------|-----------------------------
ksmbd_session_register           |
ksmbd_expire_session             |
                                 | ksmbd_server_terminate_conn
                                 | ksmbd_sessions_deregister
ksmbd_session_destroy(sess)      |   |
    |                            |   |
    hash_del(&sess->hlist);      |   |
    kfree(sess);                 |   |
                                 |   hash_del(&sess->hlist);
When enabling KASAN, the issue was manifested by the following crashes:
BUG: KASAN: slab-use-after-free in __hlist_del include/linux/list.h:990 [inline]
BUG: KASAN: slab-use-after-free in hlist_del_init include/linux/list.h:1016 [inline]
BUG: KASAN: slab-use-after-free in hash_del include/linux/hashtable.h:107 [inline]
BUG: KASAN: slab-use-after-free in ksmbd_sessions_deregister+0x569/0x5f0 fs/smb/server/mgmt/user_session.c:247
Write of size 8 at addr ffff888126050c70 by task ksmbd:51780/39072

BUG: KASAN: slab-use-after-free in hlist_add_head include/linux/list.h:1034 [inline]
BUG: KASAN: slab-use-after-free in __session_create fs/smb/server/mgmt/user_session.c:420 [inline]
BUG: KASAN: slab-use-after-free in ksmbd_smb2_session_create+0x74a/0x750 fs/smb/server/mgmt/user_session.c:432
Write of size 8 at addr ffff88816df5d070 by task kworker/5:2/139
Both issues result in an out-of-bounds (OOB) write at offset 112.
The vulnerability was introduced in the commit 7aa8804c0b, when implementing the reference count for sessions to avoid UAF:
// https://github.com/torvalds/linux/blob/7aa8804c0b67b3cb263a472d17f2cb50d7f1a930/fs/smb/server/server.c
send:
	if (work->sess)
		ksmbd_user_session_put(work->sess);
	if (work->tcon)
		ksmbd_tree_connect_put(work->tcon);
	smb3_preauth_hash_rsp(work); // [8]
	if (work->sess && work->sess->enc && work->encrypted &&
	    conn->ops->encrypt_resp) {
		rc = conn->ops->encrypt_resp(work);
		if (rc < 0)
			conn->ops->set_rsp_status(work, STATUS_DATA_ERROR);
	}

	ksmbd_conn_write(work);
Here, the ksmbd_user_session_put decrements the sess->refcnt and if the value reaches zero, the kernel is permitted to free the sess object ([7]):
// https://github.com/torvalds/linux/blob/7aa8804c0b67b3cb263a472d17f2cb50d7f1a930/fs/smb/server/mgmt/user_session.c#L296
void ksmbd_user_session_put(struct ksmbd_session *sess)
{
	if (!sess)
		return;

	if (atomic_read(&sess->refcnt) <= 0)
		WARN_ON(1);
	else
		atomic_dec(&sess->refcnt); // [7]
}
The smb3_preauth_hash_rsp function ([8]) that follows accesses the sess object without verifying if it has been freed ([9]):
// https://github.com/torvalds/linux/blob/7aa8804c0b67b3cb263a472d17f2cb50d7f1a930/fs/smb/server/smb2pdu.c#L8859
	if (le16_to_cpu(rsp->Command) == SMB2_SESSION_SETUP_HE && sess) {
		__u8 *hash_value;

		if (conn->binding) {
			struct preauth_session *preauth_sess;

			preauth_sess = ksmbd_preauth_session_lookup(conn, sess->id);
			if (!preauth_sess)
				return;
			hash_value = preauth_sess->Preauth_HashValue;
		} else {
			hash_value = sess->Preauth_HashValue; // [9]
			if (!hash_value)
				return;
		}
		ksmbd_gen_preauth_integrity_hash(conn, work->response_buf,
						 hash_value);
	}
This can result in a use-after-free (UAF) condition when accessing the freed object, as detected by KASAN:
BUG: KASAN: slab-use-after-free in smb3_preauth_hash_rsp (fs/smb/server/smb2pdu.c:8875)
Read of size 8 at addr ffff88812f5c8c38 by task kworker/0:9/308
After reporting the bugs and confirming the fix, we identified another issue when sending a large number of packets. Each time queue_ksmbd_work is invoked during a socket connection, it allocates data through ksmbd_alloc_work_struct
// https://elixir.bootlin.com/linux/v6.11/source/fs/smb/server/ksmbd_work.c#L21
struct ksmbd_work *ksmbd_alloc_work_struct(void)
{
	struct ksmbd_work *work = kmem_cache_zalloc(work_cache, GFP_KERNEL);
    // ..
}
In SMB, credits are designed to control the number of requests a client can send. However, the affected code executed before enforcing the credit limits.
After approximately two minutes of sending these packets through a remote socket, the system consistently encountered a kernel panic and restarted:
[  287.957806] Out of memory and no killable processes...
[  287.957813] Kernel panic - not syncing: System is deadlocked on memory
[  287.957824] CPU: 2 UID: 0 PID: 2214 Comm: ksmbd:52086 Tainted: G    B              6.12.0-rc5-00181-g6c52d4da1c74-dirty #26
[  287.957848] Tainted: [B]=BAD_PAGE
[  287.957854] Hardware name: QEMU Standard PC (i440FX + PIIX, 1996), BIOS 1.15.0-1 04/01/2014
[  287.957863] Call Trace:
[  287.957869]  <TASK>
[  287.957876] dump_stack_lvl (lib/dump_stack.c:124 (discriminator 1))
[  287.957895] panic (kernel/panic.c:354)
[  287.957913] ? __pfx_panic (kernel/panic.c:288)
[  287.957932] ? out_of_memory (mm/oom_kill.c:1170)
[  287.957964] ? out_of_memory (mm/oom_kill.c:1169)
[  287.957989] out_of_memory (mm/oom_kill.c:74 mm/oom_kill.c:1169)
[  287.958014] ? mutex_trylock (./arch/x86/include/asm/atomic64_64.h:101 ./include/linux/atomic/atomic-arch-fallback.h:4296 ./include/linux/atomic/atomic-long.h:1482 ./include/linux/atomic/atomic-instrumented.h:4458 kernel/locking/mutex.c:129 kernel/locking/mutex.c:152 kernel/locking/mutex.c:1092)
The reason was that the ksmbd kept creating threads, and after forking more than 2000 threads, the ksmbd_work_cache depleted available memory.
This could be confirmed by using slabstat or inspecting /proc/slabinfo. The number of active objects steadily increased, eventually exhausting kernel memory and causing the system to restart:
# ps auxww | grep -i ksmbd | wc -l
2069

# head -2 /proc/slabinfo; grep ksmbd_work_cache /proc/slabinfo
slabinfo - version: 2.1
# name            <active_objs> <num_objs> <objsize> <objperslab> <pagesperslab> : tunables <limit> <batchcount> <sharedfactor> : slabdata <active_slabs> <num_slabs> <sharedavail>
ksmbd_work_cache  16999731 16999731    384   21    2 : tunables    0    0    0 : slabdata 809511 809511      0
This issue was not identified by syzkaller but was uncovered through manual testing with the triggering code.
Even though syzkaller identified and triggered two of the vulnerabilities, it failed to generate a reproducer, requiring manual analysis of the crash reports. These issues were accessible without authentication and further improvements in fuzzing are likely to uncover additional bugs either from complex locking mechanisms that are difficult to implement correctly or other factors. Due to time constraints, we did not attempt to create a fully working exploit for the UAF.
During my recent internship with Doyensec, I had the opportunity to research decompression attacks across different programming languages. As the use of archive file formats is widespread in software development, it is crucial for developers to understand the potential security risks involved in handling these files.
The objective of my research was to identify, analyze, and detect vulnerable implementations in several popular programming languages used for web and app development, including Python, Ruby, Swift, Java, PHP, and JavaScript. These languages have libraries for archive decompression that, when used improperly, may potentially lead to vulnerabilities.
To demonstrate the risk of unsafe unpacking, I created proof-of-concept (PoC) code with different vulnerable implementations for each method and each language. My work also focused on safe alternatives for each one of the vulnerable implementations. Additionally, I created a web application to upload and test whether the code used in a specific implementation is safe or not.
To efficiently search for vulnerabilities on larger codebases, I used a popular SAST (Static Application Security Testing) tool - Semgrep. Specifically, I wrote a set of rules to automatically detect those vulnerable implementations which it will make it easier to identify vulnerabilities.
Secure and insecure code, labs and Semgrep rules for all programming languages have been published on https://github.com/doyensec/Unsafe-Unpacking.
Extracting an archive (e.g., a ZIP file) usually involves reading all its contents and writing them to the specified extraction path. An archive path traversal aims to extract files to directories that are outside the intended extraction path.
This can occur when archive extraction is improperly handled, as archives may contain files with filenames referencing parent directories (e.g., using ../). If not properly checked, these sequences may cause the extraction to occur outside the intended directory.
For example, consider a ZIP file with the following structure:
/malicious
    /foo.txt
    /foo.py
    /../imbad.txt
When unzipping the archive to /home/output, if the extraction method does not validate or sanitize the file paths, the contents may be written to the following locations:
/home/output/foo.txt
/home/output/foo.py
/home/imbad.txt
As a result, imbad.txt would be written outside the intended directory. If the vulnerable program runs with high privileges, this could also allow the attacker to overwrite sensitive files, such as /etc/passwd – where Unix-based systems store user account information.
To demonstrate the vulnerability, I created several proof-of-concept examples in various programming languages. These code snippets showcase vulnerable implementations where the archive extraction is improperly handled.
The combination of the ZipFile library as reader and shutil.copyfileobj() as writer makes the programmer responsible for handling the extraction correctly.
The usage of shutil.copyfileobj() is straightforward: as the first argument, we pass the file descriptor of the file whose contents we want to extract, and as the second argument, we pass the file descriptor to the destination file. Since the method receives file descriptors instead of paths, it doesn’t know if the path is out of the output directory, making the following implementation vulnerable.
def unzip(file_name, output):
    # bad
    with zipfile.ZipFile(file_name, 'r') as zf:
        for filename in zf.namelist():
            # Output
            output_path = os.path.join(output, filename)
            with zf.open(filename) as source:
                with open(output_path, 'wb') as destination:
                    shutil.copyfileobj(source, destination)

unzip1(./payloads/payload.zip", "./test_case")
If we run the previous code, we’ll realize that instead of extracting the zip content (poc.txt) to the test_case folder, it will be extracted to the parent folder:
$ python3 zipfile_shutil.py

$ ls test_case
# No output, empty folder

$ ls
payloads  poc.txt  test_case  zipfile_shutil.py
Zip::File.open(file_name).extract(entry, file_path)
The extract() method in Ruby’s zip library is used to extract an entry from the archive to the file_path directory. This method is unsafe since it doesn’t remove redundant dots and path separators. It’s the caller’s responsibility to make sure that file_path is safe:
require 'zip'

def unzip1(file_name, file_path)
  # bad
  Zip::File.open(file_name) do |zip_file|
    zip_file.each do |entry|
      extraction_path = File.join(file_path, entry.name)
      FileUtils.mkdir_p(File.dirname(extraction_path))
      zip_file.extract(entry, extraction_path)
    end
  end
end

unzip1('./payloads/payload.zip', './test_case/')
$ ruby zip_unsafe.rb

$ ls test_case
# No output, empty folder

$ ls
payloads  poc.txt  test_case  zip_unsafe.rb
All the other cases are documented in Doyensec’s repository, along with the Semgrep rules and the labs.
As part of the research, I developed a few web applications that allow users to test whether specific archive extraction implementations are vulnerable to decompression attacks.
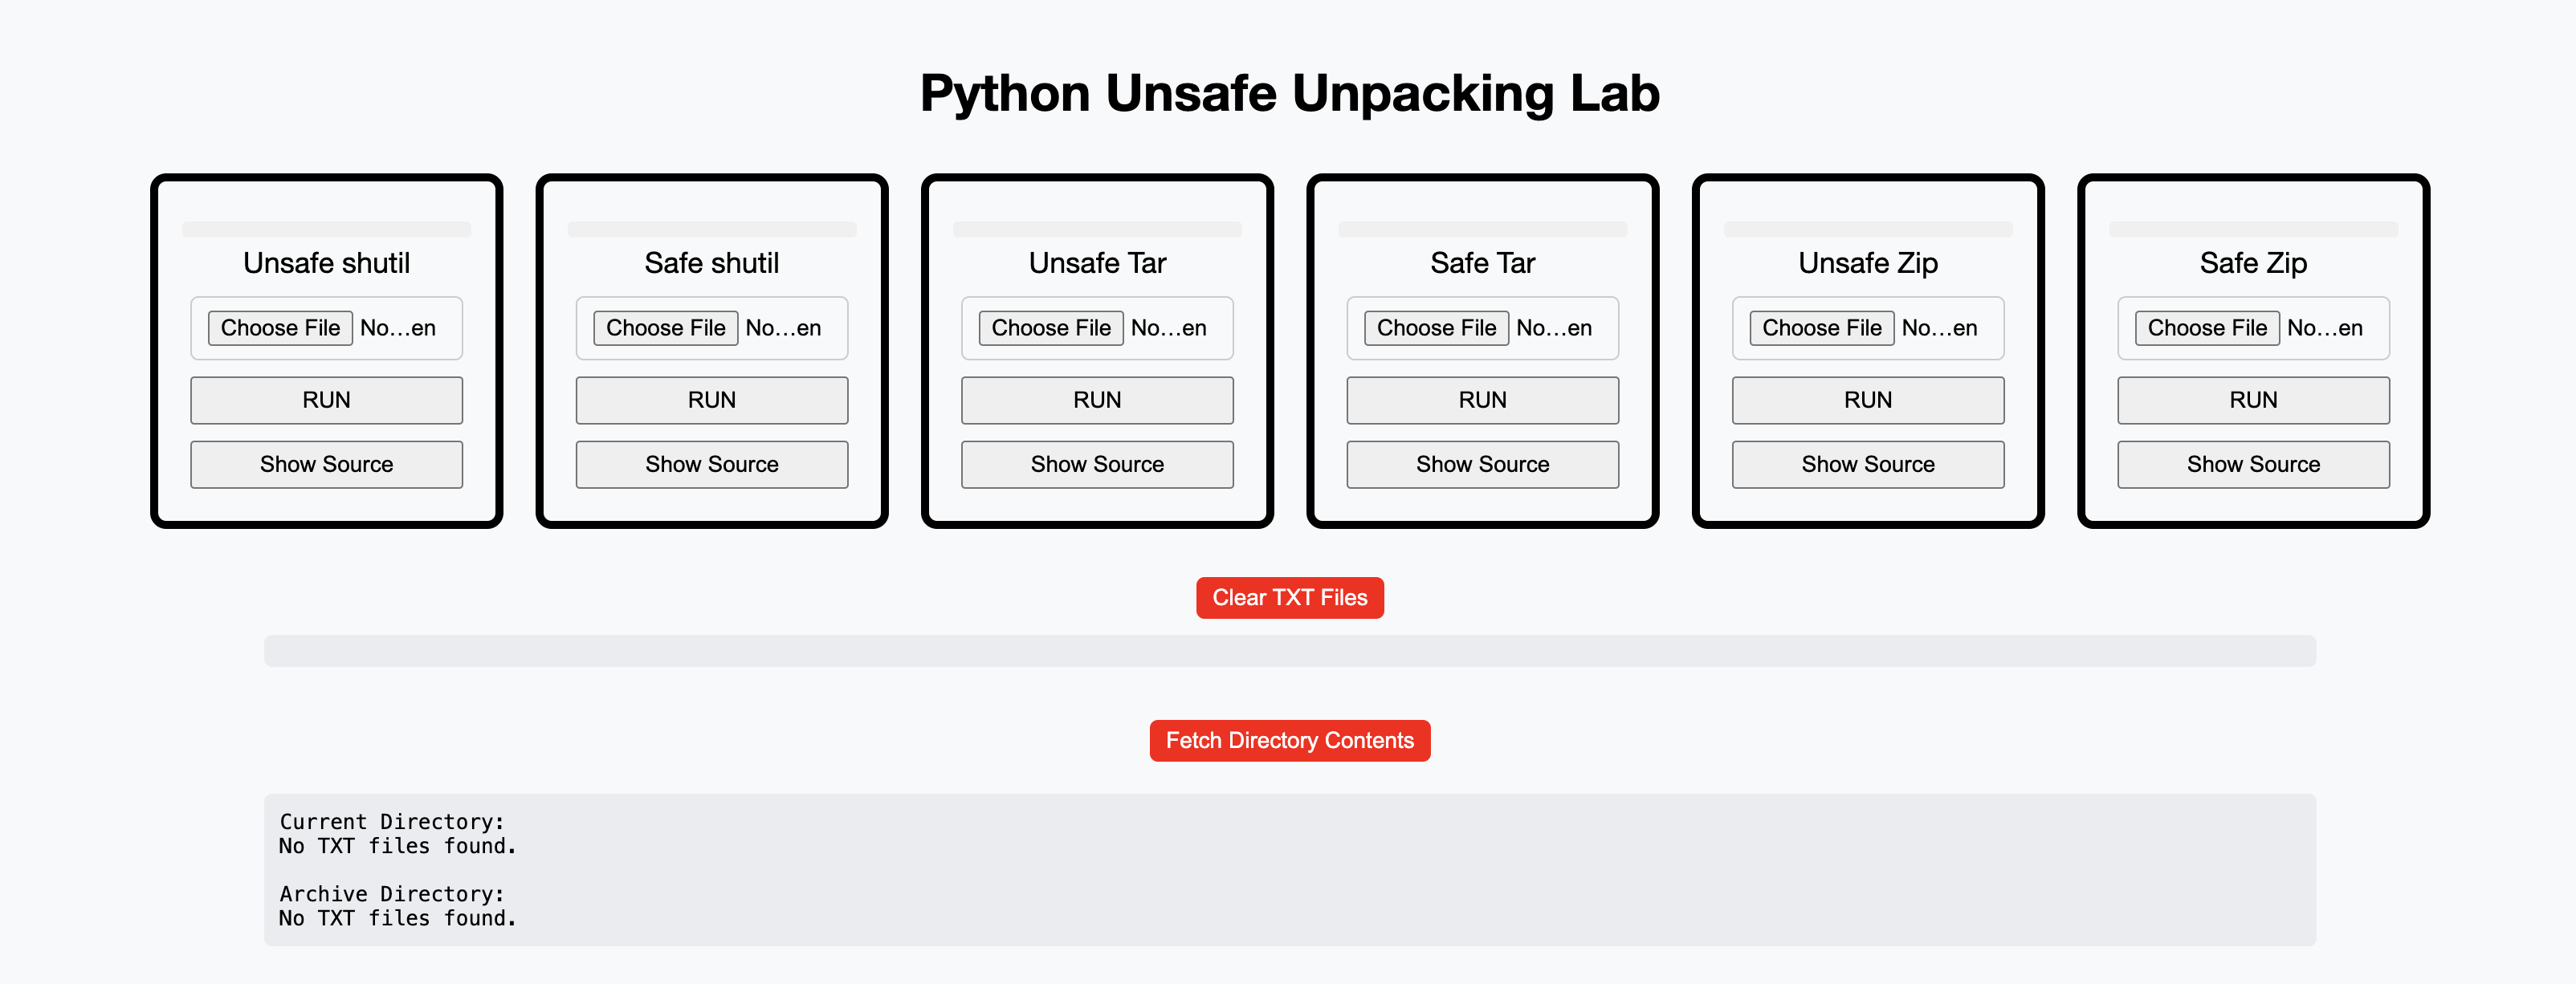
RUN: without uploading an archive, the application will extract one of the prebuilt malicious archives. If the user uploads an archive, that archive will be unpacked instead.
Clear TXT Files: the application will remove all the extracted files from the previous archives.
Fetch Directory Contents: the web application will show you both the archive directory (where files are supposed to be extracted) and the current directory (where files are NOT supposed to be extracted).
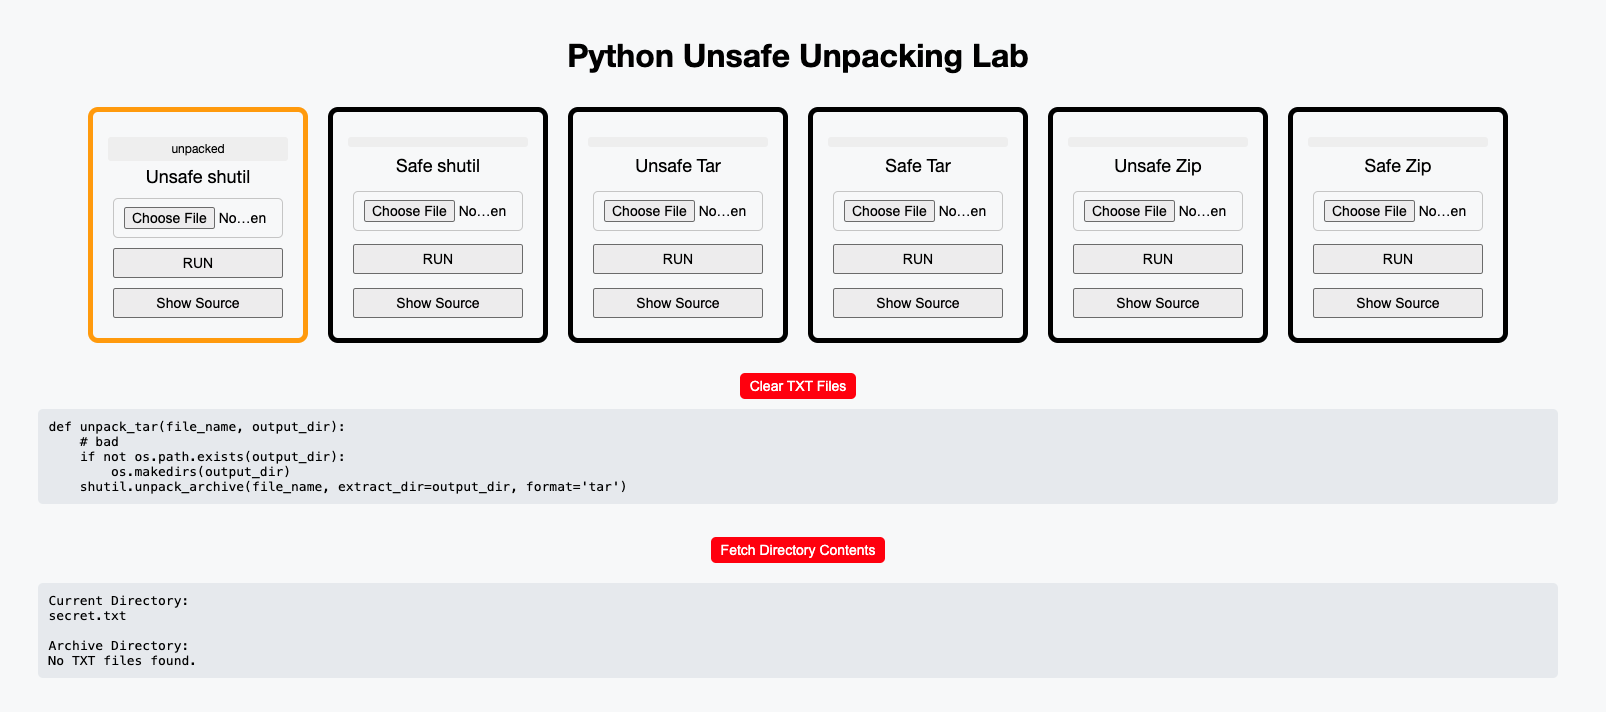
These web application labs are available for every language except Swift, for which a desktop application is provided instead.
One of the most efficient ways to detect vulnerabilities in open-source projects is by using static application analysis tools. Semgrep is a fast, open-source, static analysis tool that searches code, finds bugs, and enforces secure guardrails and coding standards.
Semgrep works by scanning source code for specific syntax patterns. Since it supports various programming languages and makes it simple to write custom rules, it was ideal for my research purposes.
In the following example I’m using the Unsafe-Unpacking/Python/PoC/src folder from the GitHub repository, which contains 5 unzipping vulnerabilities. You can run the Semgrep rule by using the following command:
semgrep scan --config=../../rules/zip_shutil_python.yaml

...

┌─────────────────┐
│ 5 Code Findings │
└─────────────────┘

    zipfile_shutil.py
   ❯❯❱ rules.unsafe_unpacking
          Unsafe Zip Unpacking

           13┆ shutil.copyfileobj(source, destination)
            ⋮┆----------------------------------------
           21┆ shutil.copyfileobj(source, destination)
            ⋮┆----------------------------------------
           31┆ shutil.copyfileobj(source, destination)
            ⋮┆----------------------------------------
           41┆ shutil.copyfileobj(source, destination)
            ⋮┆----------------------------------------
           57┆ shutil.copyfileobj(source_file, target_file)
A set of 15 rules can be found in the GitHub repository.
Since in most of the vulnerable implementations the programmer is responsible for sanitizing or validating the output path, they can take two approaches to mitigate the problem.
To sanitize the path, the filename should be normalized. In the case of Ruby, the method Path.basename can be used, which removes redundant dots and converts a path like ../../../../bad.txt to bad.txt.
In the following code, when using File.join to compute the output path, File.basename is called to sanitize the entry filename from the archive, mitigating the vulnerability:
def safe_unzip(file_name, output)
  # good
  Zip::File.open(file_name) do |zip_file|
    zip_file.each do |entry|
      # sanitize the entry path
      file_path = File.join(output, File.basename(entry.name))
      FileUtils.mkdir_p(File.dirname(file_path))
      zip_file.extract(entry, file_path)
    end
  end
end
The side effect of this mitigation is that the archive’s folder structure is flattened, and all files are extracted to a single folder. Due to this, the solution may not be ideal for many applications.
Another solution would be using Pathname.new().cleanpath, pathname (a built-in Ruby class). It can normalize paths and remove any ../ sequences:
require 'pathname'

def safe_unzip(file_name, output)
  output += File::SEPARATOR unless output.end_with?(File::SEPARATOR)

  Zip::File.open(file_name) do |zip_file|
    zip_file.each do |entry|
      # Remove any relative path components like "../"
      sanitized_name = Pathname.new(entry.name).cleanpath.to_s
      sanitized_path = File.join(output, sanitized_name)

      FileUtils.mkdir_p(File.dirname(sanitized_path))
      zip_file.extract(entry, sanitized_path)
    end
  end
end
However, if the developer wants to sanitize the path themselves by removing ../ using any kind of replacement, they should make sure that the sanitization is applied repeatedly until there are no ../ sequences left. Otherwise, cases like the following can occur, leading to a bypass:
entry = "..././bad.txt"
sanitized_name = entry.gsub(/(\.\.\/)/, '') # ../bad.txt
Before writing the contents of the entry to the destination path, you should ensure that the write path is within the intended destination directory. This can be done by using start_with? to check if the write path starts with the destination path, which prevents directory traversal attacks.
def safe_unzip(file_name, output)
  output += File::SEPARATOR unless output.end_with?(File::SEPARATOR)
  # good
  Zip::File.open(file_name) do |zip_file|
    zip_file.each do |entry|
      safe_path = File.expand_path(entry.name, output)

      unless safe_path.start_with?(File.expand_path(output))
        raise "Attempted Path Traversal Detected: #{entry.name}"
      end

      FileUtils.mkdir_p(File.dirname(safe_path))
      zip_file.extract(entry, safe_path)
    end
  end
end
It’s important to note that File.expand_path should be used instead of File.join. Using File.expand_path() is crucial because it converts a relative file path into an absolute file path, ensuring proper validation and preventing path traversal attacks.
For example, consider the following secure approach using File.expand_path:
# output = Ruby/PoC/test_case

# path = Ruby/PoC/secret.txt
path = File.expand_path(entry_var, output)

# Check for path traversal
unless path.start_with?(File.expand_path(output))
    raise "Attempted Path Traversal Detected: #{entry_var}"
end
In this case File.expand_path converts path to an absolute path, and the check with start_with correctly verifies whether the extracted file path is within the intended output directory.
On the other hand, if you use File.join to build the output path, it may result in vulnerabilities:
# output = Ruby/PoC/test_case

# path = Ruby/PoC/test_case/../secret.txt
path = File.join(output, entry_var)

# Incorrect check
unless path.start_with?(File.expand_path(output))
    raise "Attempted Path Traversal Detected: #{entry_var}"
end
The check would incorrectly return true even though the path actually leads outside the intended directory (test_case/../secret.txt), allowing an attacker to bypass the validation and perform a path traversal. The takeaway is to always normalize the path before verifying.
One detail I missed, which my mentor (Savio Sisco) pointed out, is that in the original safe_method, I didn’t include the following line:
output += File::SEPARATOR unless output.end_with?(File::SEPARATOR)
Without this line, it was still possible to bypass the start_with check. Although path traversal is not possible in this case, it could still lead to writing outside of the intended directory:
output = "/home/user/output"
entry.name = "../output_bypass/bad.txt"
safe_path = File.expand_path(entry.name, output) # /home/user/output_bypass/bad.txt
safe_path.start_with?(File.expand_path(output))# true
This research delves into the issue of unsafe archive extraction across various programming languages. The post shows how giving developers more freedom also places the responsibility on them. While manual implementations are important, they can also introduce serious security risks.
Additionally, as security researchers, it is important to understand the root cause of the vulnerability. By developing Semgrep rules and labs, we hope it will help others to identify, test and mitigate these vulnerabilities. All these resources are available in the Doyensec repository.
Decompression attacks are a broad field of research. While this blog covers some cases related to file extraction, there are still many other attacks, such as zip bombs and symlink attacks, that need to be considered.
Although this blog post is not about the internship, I would like to use this opportunity to discuss my experience too.
Two years ago, during my OSWE preparation, I came across a Doyensec blog post, and I used them as study resource . Months later, I found out they here hiring for an internship which I thought was an incredible opportunity.
The first time I applied, I received my very first technical challenge — a set of vulnerable code that was a lot of fun to work with if you enjoy reading code. However, I wasn’t able to pass the challenge that year. This year, after two interview rounds with Luca and John, I was finally accepted. The interviews were 360 degree, covering various aspects like how to fix a vulnerability, how computers work, how to make a secure snippet vulnerable, and how to approach threat modeling.
In my first few weeks, I was assigned to some projects with a lot of guidance from other security engineers. I had the chance to talk to them about their work at Doyensec and even chat with one former intern about his internship experience. I learned a lot about the company’s methodology, not only in terms of bug hunting but also in how to be more organized — both in work and in life. Just like many CTF players, I was used to working late into the night, but since I wasn’t working alone on these projects, this habit started to interfere with communication. Initially, it felt strange to open Burp when the sun was still up, but over time, I got used to it. I didn’t realize how much this simple change could improve my productivity until I fully adjusted.
Working on projects with large codebases or complex audits really pushed me to keep searching for bugs, even when it seemed like a dead end. There were times when I got really nervous after days without finding anything of interest. However, Savio was a great help during these moments, advising me to stay calm and stick to a clear methodology instead of letting my nerves drive me hunt without thinking. Eventually, I was able to find some cool bugs on those projects.
Even though I had very high expectations, this experience definitely lived up to them. A huge thanks to the team, especially Luca and Savio, who took great care of me throughout the entire process.