
Client-side JavaScript Instrumentation
25 Sep 2023 - Posted by Dennis GoodlettThere is a ton of code that is not worth your time and brain power. Binary reverse engineers commonly skip straight to the important code by using ltrace, strace, or frida. You can do the same for client side JavaScript using only common browser features. This will save time, make testing more fun and help keep your attention span available for the code that deserves your focus.
This blog introduces my thinking processes and practical methods for instrumenting client side JavaScript. This processes have helped me to find deeply embedded bugs in complicated codebases with relative ease. I have been using many of these tricks for so long that I implemented them in a web extension called Eval Villain. While I will introduce you to some of Eval Villain’s brand new features, I will also show how to get the same results without Eval Villain.
General Method and Thinking
Testing an application often raises questions as to how the application works. The client must know the answers to some of these questions if the application is to function. Consider the following questions:
- What parameters does the server accept?
- How are parameters encoded/encrypted/serialized?
- How does the wasm module affect the DOM?
- Where are the DOM XSS sinks and what sanitization is being applied?
- Where are the post message handlers?
- How is cross-origin communication between ads being accomplished?
For the web page to work, it needs to know the answer to these questions. This
means we can find our answers in the JavaScript too. Notice that each of these
questions imply the use of particular JavaScript functions. For example, how
would the client implement a post message handler without ever calling
addEventListener? So “Step 1” is hooking these interesting functions,
verifying the use case is what we are interested in and tracing back. In
JavaScript, it would look like this:
(() => {
    const orig = window.addEventListener;
    window.addEventListener = function(a, b) {
        if (a === "message") {
            console.log("postMessage handler found");
            console.log(b); // You can click the output of this to go directly to the handler
            console.trace(); // Find where the handler was registered.
        }
        return orig(...arguments);
    }
})();
Just pasting the above code in the console will work if the handler has not already been registered. However, it is crucial to hook the function before it’s even used. In the next section I will show a simple and practical way to always win that race.
Hooking native JavaScript is “Step 1”. This often helps you find interesting code. Sometimes you will want to instrument that code but it’s non-native. This requires a different method that will be covered in the “Step 2” section.
Step 1: Hooking native JavaScript
Build your own Extension
While you can use one of many web extensions that will add arbitrary JavaScript to the page, I don’t recommend it. These extensions are often buggy, have race conditions and are difficult to develop in. In most cases, I find it easier to just write my own extension. Don’t be daunted, it is really easy. You only need two files and I already made them for you here.
To load the code in Firefox go to about:debugging#/runtime/this-firefox in
the URL bar, click Load Temporary Add-on and navigate to the manifest.json
file in the top directory of the extension.
For chrome, go to chrome://extensions/, enable developer mode in the right
side and click load unpacked.
The extension should show up in the addon list, where you can quickly
enable or disable it. When enabled, the script.js file will load in every web
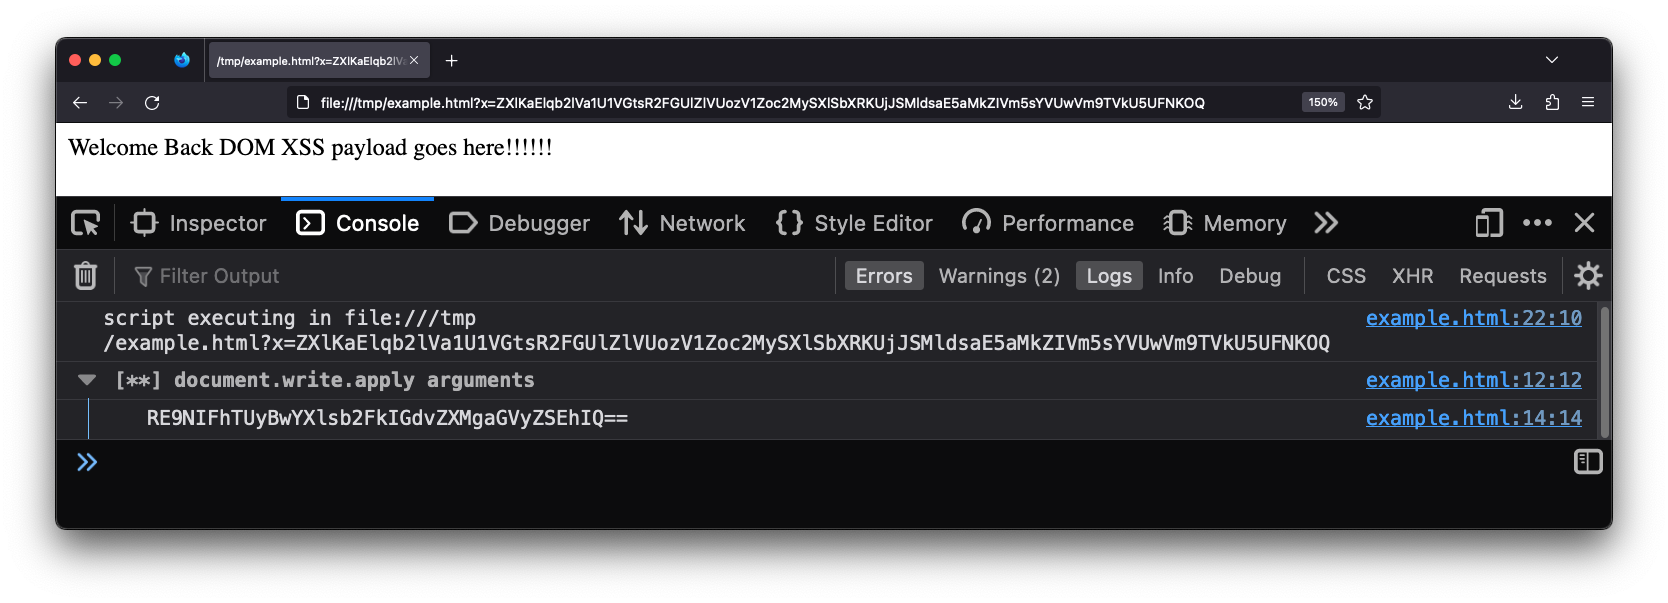
page. The following lines of code log all input to document.write.
	/*********************************************************
	 ***  Your code goes goes here to run in pages scope  ***
	 *********************************************************/

	// example code to dump all arguments to document.write
	document.write = new Proxy(document.write, {
		apply: function(_func, _doc, args) {
			console.group(`[**] document.write.apply arguments`);
				for (const arg of args) {
					console.dir(arg);
				}
			console.groupEnd();
			return Reflect.apply(...arguments);
		}
	});
Replace those lines of code with what ever you want. Your code will run in every page and frame before the page has the opportunity to run its own code.
How it works
The boiler plate uses the manifest file to register a content script. The manifest tells the browser that the content script should run in every frame and before the page loads. Content scripts do not have direct access to the scope of the page they are loaded into but they do have direct access to the DOM. So the boiler plate code just adds a new script into the pages DOM. A CSP can prohibit this, so the extension checks that it worked. If a CSP does block you, just disable the CSP with browser configs, a web extension or an intercepting proxy.
Notice that the instrumentation code ultimately ends up with the same privileges as the website. So your code will be subject to the same restrictions as the page. Such as the same origin policy.
Async and Races
A quick word of warning. The above content script will give you first access to
the only JavaScript thread. The website itself can’t run any JavaScript until
you give up that thread. Try it out, see if you can make a website that runs
document.write before the boiler plate has it hooked.
First access is a huge advantage, you get to poison the environment that the website is about to use. Don’t give up your advantage until you are done poisoning. This means avoiding the use of async functions.
This is why many web extensions intended to inject user JavaScript into a page are buggy. Retrieving user configuration in a web extension is done using an async call. While the async is looking up the user config, the page is running its code and potentially has already executed the sink you wanted to hook. This is why Eval Villain is only available on Firefox. Firefox has a unique API that can register the content script with the user configuration.
Eval Villain
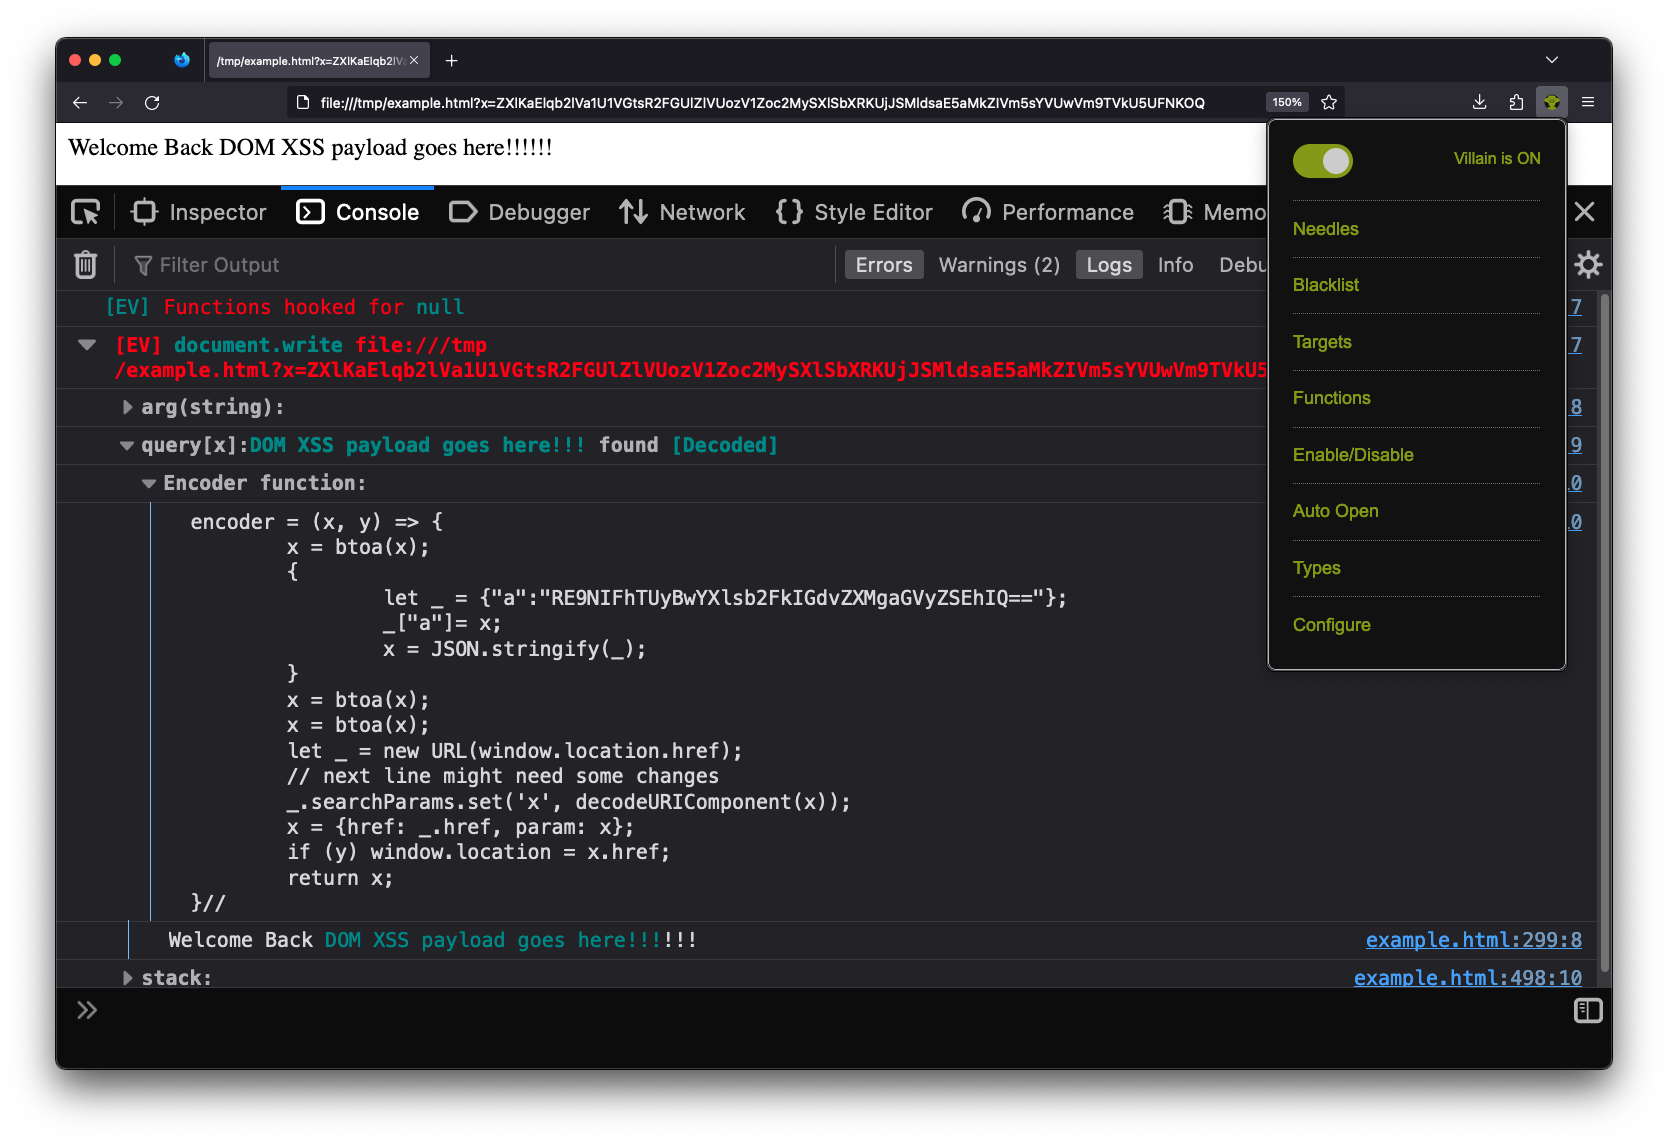
It is very rare that I run into a “Step 1” situation that can’t be solved with Eval Villain. Eval Villain is just a content script that hooks sinks and searches input for sources. You can configure almost any native JavaScript functionality to be a sink. Sources include user configure strings or regular expressions, URL parameters, local storage, cookies, URL fragment and window name. These sources are recursively decoded for important substrings. Let’s look at the same page of the example above, this time with Eval Villain in its default configuration.
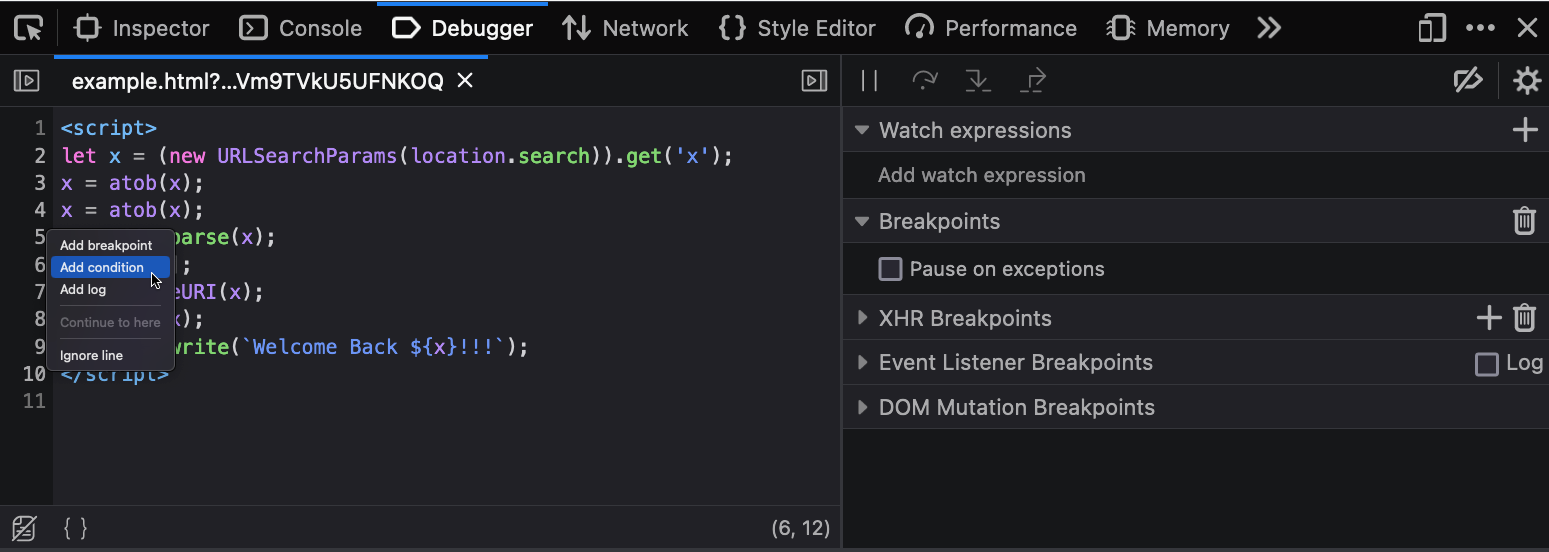
Notice this page is being loaded from a local file://. The source code is
seen below.
<script>
let x = (new URLSearchParams(location.search)).get('x');
x = atob(x);
x = atob(x);
x = JSON.parse(x);
x = x['a'];
x = decodeURI(x);
x = atob(x);
document.write(`Welcome Back ${x}!!!`);
</script>
Even though the page has no web requests, Eval Villain still successfully hooks
the user configured sink document.write before the page uses it. There is no
race condition.
Also notice that Eval Villain is not just displaying the input of
document.write. It correctly highlighted the injection point. The URL
parameter x contained an encoded string that hit the sink document.write.
Eval Villain figured this out by recursively decoding the URL parameters. Since
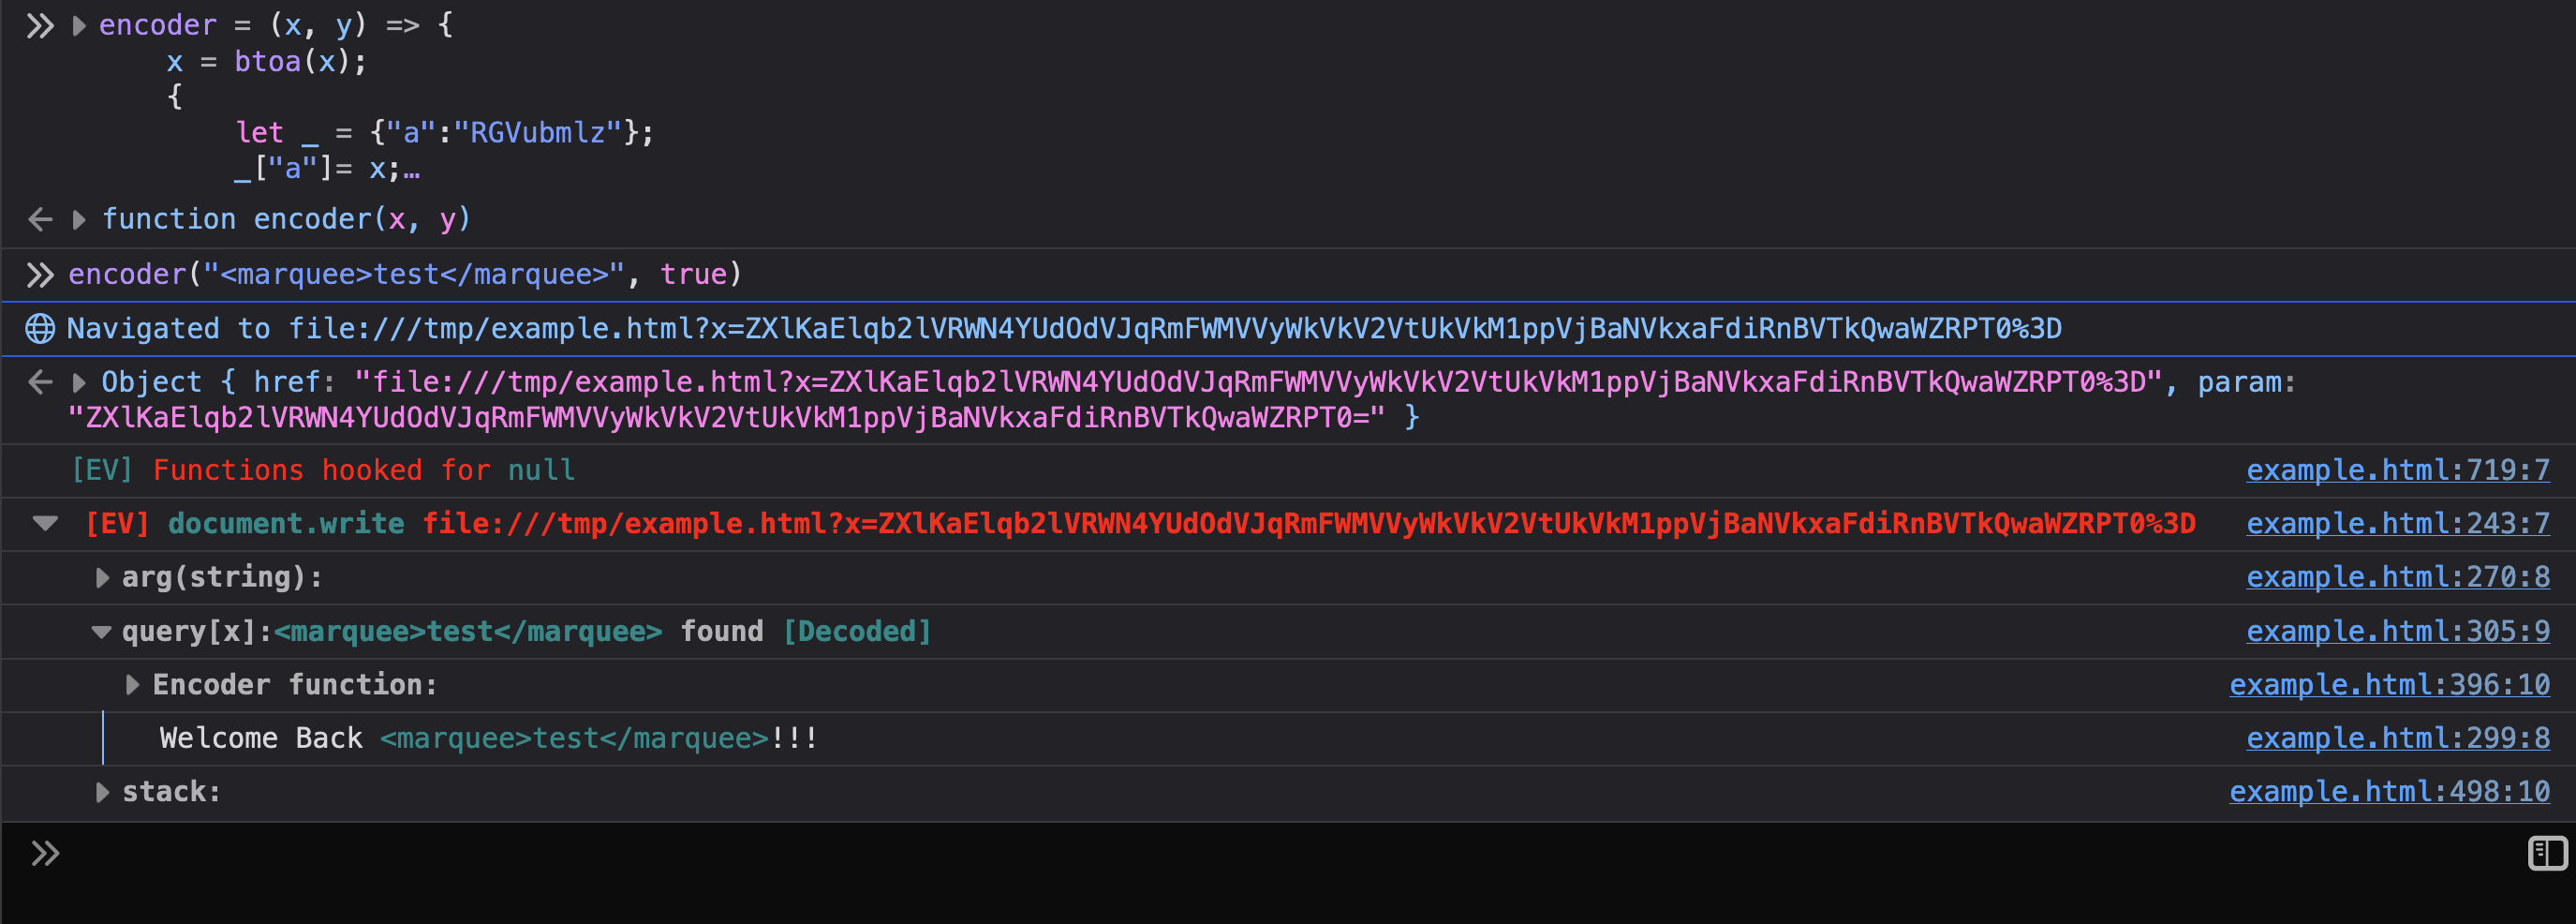
the parameter was decoded, a encoder function is provided to the user. You
can right click, copy message and paste it into the console. Using the
encoder function lets you quickly try payloads. Below shows the encoder
function being used to inject a marquee tag into the page.
If you read the previous sections, you know how this all works. Eval Villain is just using a content script to inject its JavaScript into a page. Anything it does, you can do in your own content script. Additionally, you can now use Eval Villain’s source code as your boiler plate code and customize its features for your particular technical challenge.
Step 1.5: A Quick Tip
So lets say you used “Step 1” to get a console.trace from an interesting
native function. Maybe a URL parameter hit your decodeURI sink and now your
tracing back to the URL parsing function. There is a mistake I regularly make
in this situation and I want you to do better. When you get a trace, don’t
start reading code yet!
Modern web applications often have polyfills and other cruft at the top of the
console.trace. For example, the stack trace I get on google search results
page starts with functions iAa, ka, c, ng, getAll. Don’t get tunnel
vision and start reading ka when getAll is obviously what you want. When
you look at getAll, don’t read source! Continue to scan, notice that getAll
is a method and it’s sibling are get, set, size, keys, entries and
all the other methods listed in the URLSearchParams
documentation.
We just found multiple custom URL parsers, re-implemented in minified code
without actually reading the code. “Scan” as much as you can, don’t start reading
code deeply until you find the right spot or scanning has failed you.
Step 2: Hooking non-native code
Instrumenting native code didn’t result in vulnerabilities. Now you want to instrument the non-native implementation itself. Let me illustrate this with an example.
Let’s say you discovered a URL parser function that returns an object named
url_params. This object has all the key value pairs for the URL parameters.
We want to monitor access to that object. Doing so could give us a nice list of
every URL parameter associated to a URL. We may discover new parameters this
way and unlock hidden functionality in the site.
Doing this in JavaScript is not hard. In 16 lines of code we can have a well
organized, unique list of URL parameters associated to the appropriate page and
saved for easy access in localStorage. We just need to figure out how to
paste our code right into the URL parser.
function parseURL() {
    // URL parsing code
    // url_params = {"key": "value", "q": "bar" ...

    // The code you want to add in
    url_params = new Proxy(url_params, {
        __testit: function(a) {
            const loc = 'my_secret_space';
            const urls = JSON.parse(localStorage[loc]||"{}");
            const href = location.protocol + '//' + location.host + location.pathname;
            const s = new Set(urls[href]);
            if (!s.has(a)) {
                urls[href] = Array.from(s.add(a));
                localStorage.setItem(loc, JSON.stringify(urls));
            }
        },
        get: function(a,b,c) {
            this.__testit(b);
            return Reflect.get(...arguments);
        }
    };
    // End of your code

    return url_params;
}
Chrome’s dev tools will let you type your own code into the JavaScript source but I don’t recommend it. At least for me, the added code will disappear on page load. Additionally, it is not easy to manage any instrumentation points this way.
I have a better solution and it’s built into Firefox and Chrome. Take your
instrumentation code, surround it with parenthesis, add && false to
the end. The above code becomes this:
(url_params = new Proxy(url_params, {
    __testit: function(a) {
        const loc = 'my_secret_space';
        const urls = JSON.parse(localStorage[loc]||"{}");
        const href = location.protocol + '//' + location.host + location.pathname;
        const s = new Set(urls[href]);
        if (!s.has(a)) {
            urls[href] = Array.from(s.add(a));
            localStorage.setItem(loc, JSON.stringify(urls));
        }
    },
    get: function(a,b,c) {
        this.__testit(b);
        return Reflect.get(...arguments);
    }
}) && false
Now right click the line number where you want to add your code, click “conditional breakpoint”.
Paste your code in there. Due to the && false the condition will never be
true, so you won’t ever get a breakpoint. The browser will still execute our
code and in the scope of function where we inserted the breakpoint. There are
no race conditions and the breakpoint will continue to live. It will show up in
new tabs when you open the developer tools. You can quickly disable individual
instrumentation scripts by just disabling the assisted breakpoint. Or disable
all of them by disabling breakpoints or closing the developer tools window.
I used this particular example to show just how far you can go. The instrumented code will save URL parameters, per site, to a local storage entry. At any given page you can auto-populate all known URL parameters into the URL bar by pasting the following code in to the console.
(() => {
const url = location.protocol + '//' + location.host + location.pathname;
const params = JSON.parse(localStorage.getItem("my_secret_space"))[url];
location.href = url + '?' + params.flatMap( x => `${x}=${x}`).join('&');
})()
If you use this often, you can even put the code in a bookmarklet.
Combining Native and Non-Native Instrumentation
Nothing says we can’t use native and non-native functions at the same time. You can use a content script to implement big fancy codebases. Export that functionality to the global scope and then use it in a conditional breakpoint.
This brings us to the latest feature of Eval Villain. Your conditional can make use of Eval Villains recursive decoding feature. In the pop-up menu click “configure” and go to the “globals” section. Ensure the “sourcer” line is enabled and click save.
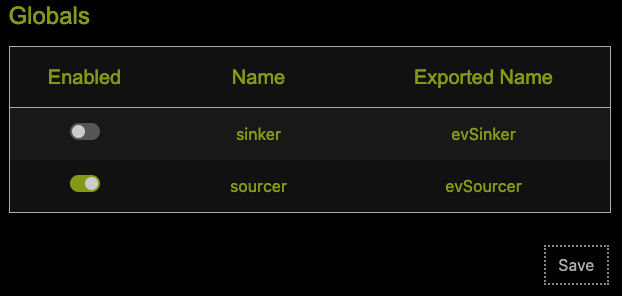
I find myself enabling/disabling this feature often, so there is a second
“enable” flag in the popup menu itself. It’s in the “enable/disable” menu as
“User Sources”. This causes Eval Villain to export the evSourcer function to
the global name scope. This will add any arbitrary object to the list of
recursively decoded sources.
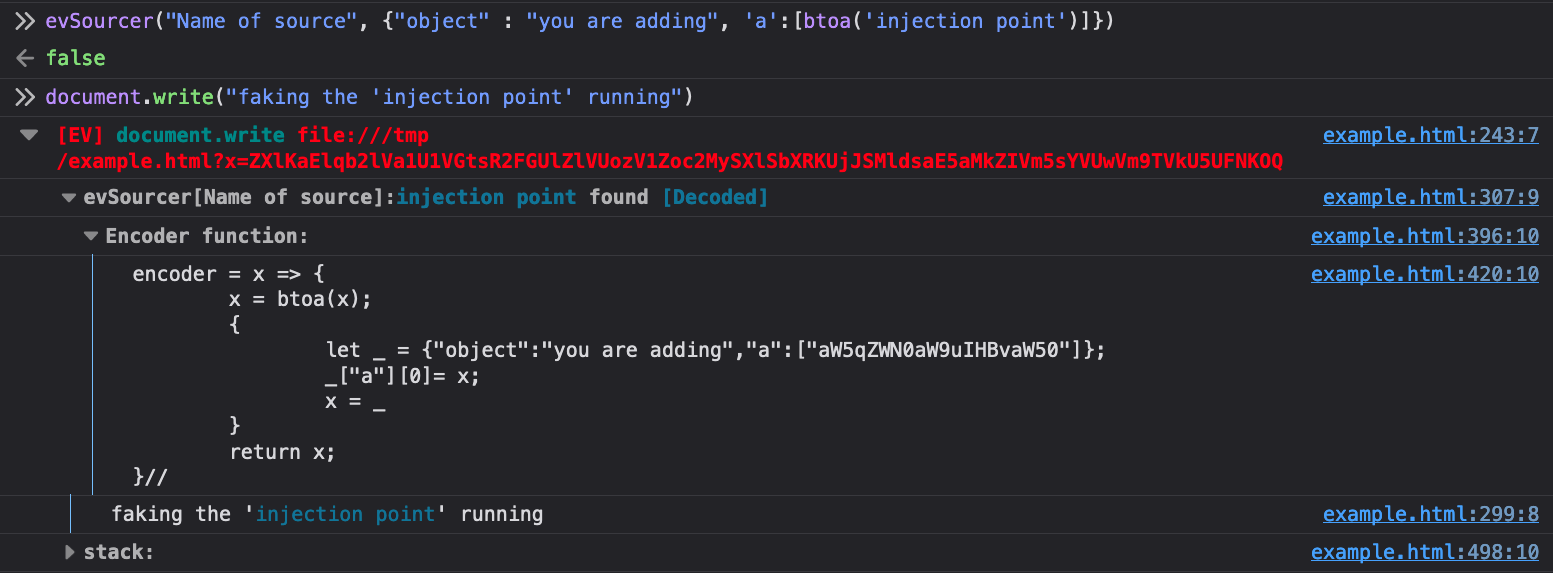
As can be seen, the first argument is what you name the source. The second is
the actual object you want to search sinks. Unless there is a custom encoding
that Eval Villain does not understand you can just put this in raw. There is an
optional third argument that will cause the sourcer to console.debug every
time it’s invoked. This function returns false, so you can use it as a
conditional breakpoint anywhere. For example, you can add this as a conditional
breakpoint that only runs in the post message handler of interest, when
receiving messages from a particular origin as a means of finding if any part
of a message will hit a DOM XSS sink. Using this in the right place can
alleviate SOP restrictions placed on your instrumentation code.
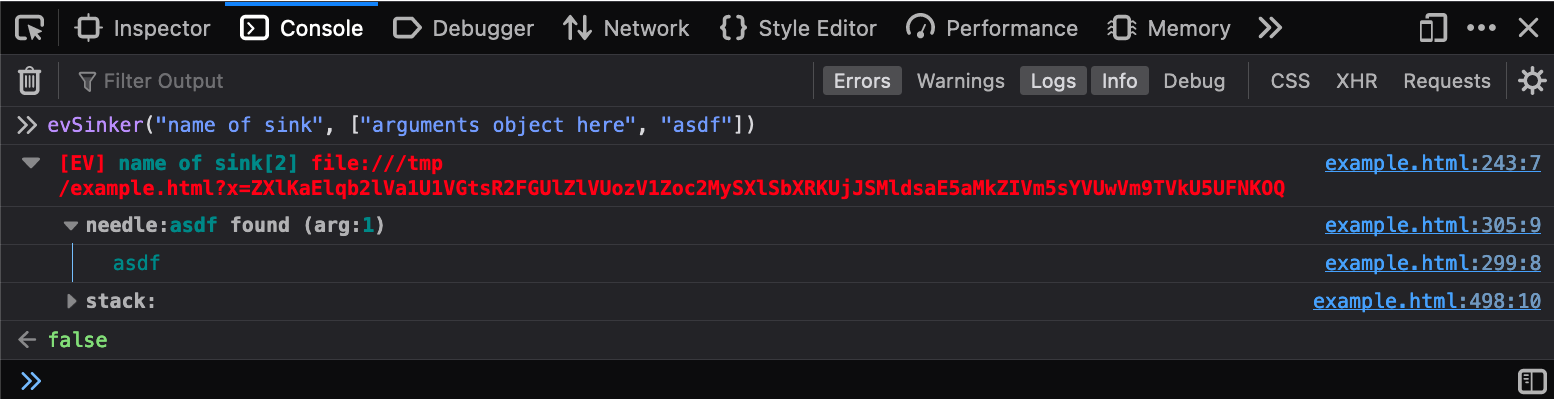
Just like the evSourcer there is an evSinker. I rarely use this, so there
is no “enable/disable” entry for this in the popup menu. It accepts a sink name
and a list of arguments and just acts like your own sink. It also returns false
so it can easily be used in conditional breakpoints.
Conclusion
Writing your own instrumentation is a powerful skill for vulnerability research. Sometimes, it only takes a couple of lines of JavaScript to tame a giant gully codebase. By knowing how this works, you can have better insight into what tools like Eval Villain and DOM invader can and can’t do. Whenever necessary, you can also adapt your own code when a tool comes up short.