ABOUT US
We are security engineers who break bits and tell stories.
Visit us
doyensec.com
Follow us
@doyensec
Engage us
info@doyensec.com
Blog Archive
© 2026 Doyensec LLC 
After a small detour, the CloudSecTidbits series is back with new episodes. We had the opportunity to present them at the first DEFCON in Singapore few days ago during our DemoLabs sessions. Meeting Singapore’s community was indeed amazing - thanks again for having us!
CloudSec Tidbits is a blogpost series showcasing interesting bugs found by Doyensec during cloud security testing activities.
We focus on vulnerabilities resulting from an insecure combination of web and cloud related technologies.
Every article includes an Infrastructure as Code (IaC) laboratory that can be easily deployed to experiment with the described vulnerability.
Time to get ready and dive into a new tidbit.
What is AWS Cognito? If you need a refresher, you can start by reading the initial AWS Cognito introduction we did back in S1 Ep.2, Tampering User Attributes In AWS Cognito User Pools.
This time we leave simple setups behind and walk through the kind of multi-tenant Cognito deployment that is becoming the SaaS default: one User Pool, many tenants, and each tenant bringing “their” external IdP.
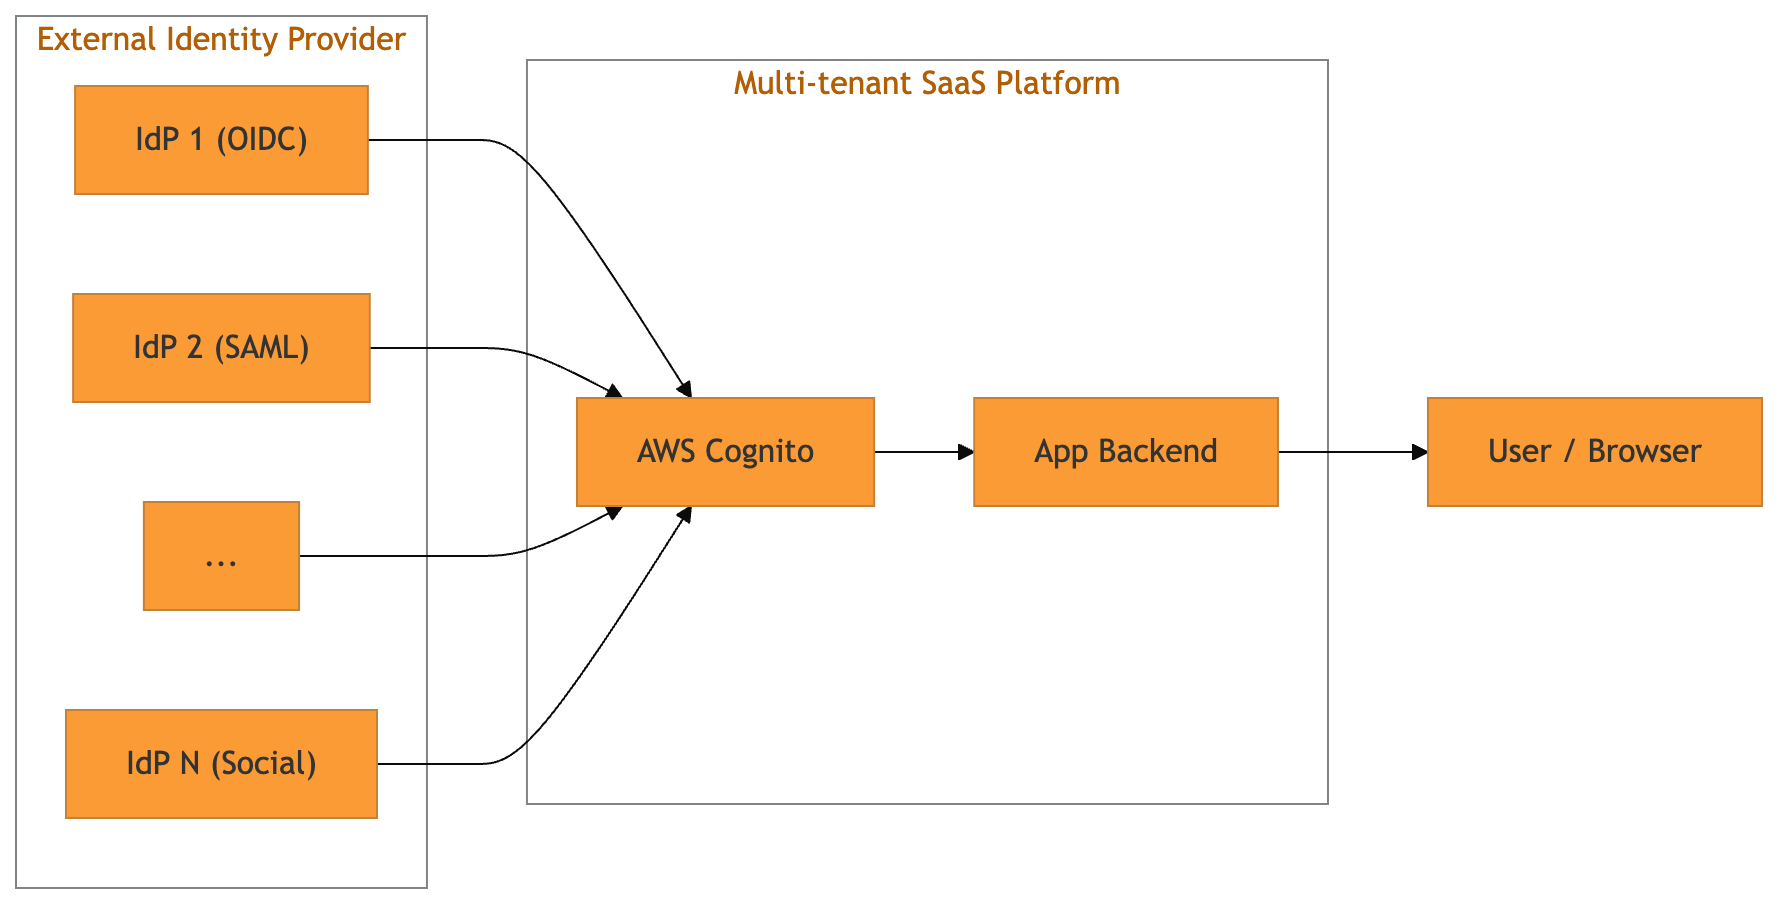
With Cognito User Pools, developers can register multiple external IdPs (OIDC and SAML) against a single pool and expose them via the hosted UI (managed login page), or via a custom login page that still hits the hosted SSO endpoints.
External IdPs are registered through the CreateIdentityProvider API. A minimal OIDC registration looks like this:
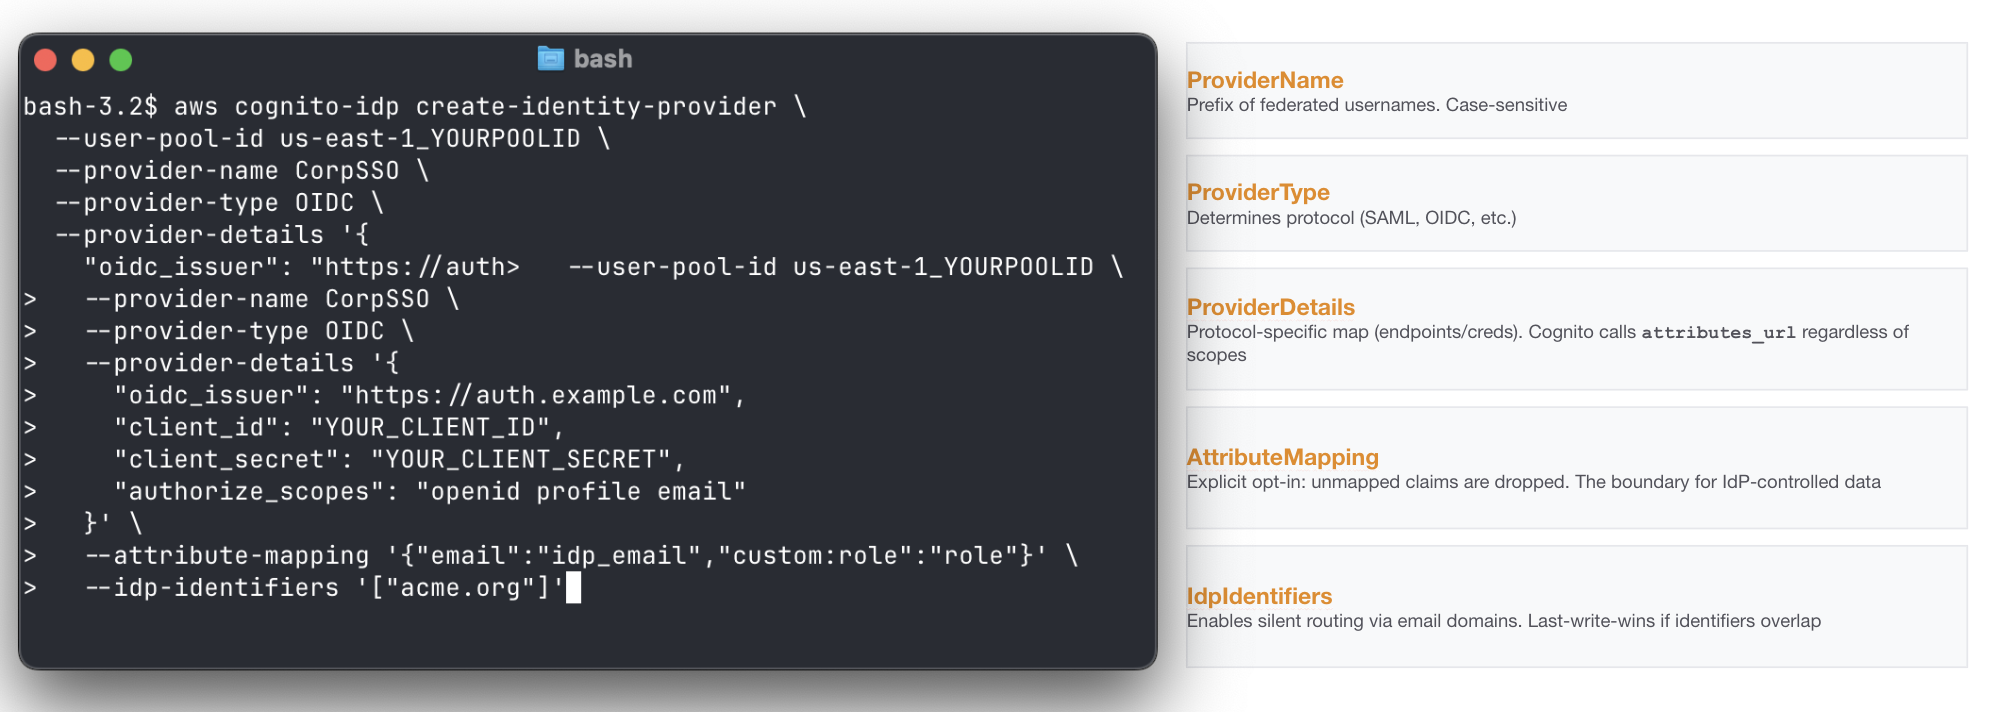
Of course, such a creation is typically made by the backend of the platform supporting custom IdP settings for its tenants.
Triggers are synchronous hooks that allow developers to embed custom logic into event-driven flows.
When it comes to Cognito, the service invokes multiple triggers at specific stages of user creation and authentication through SSO. They stop the SSO authentication flow and allow custom logic to accept, reject, or modify it. In a normal implementation, they end up carrying all the “identity glue” required by the platform to be coherent with its other identity constraints: domain allowlists and ownership checks, tenant restrictions, JIT provisioning, attribute normalization, token shaping and so on.
The clearest way to think about it is by mapping the SSO triggers execution order and event types. Below you can find our go-to boundary guide for identity checks within the numerous triggers.
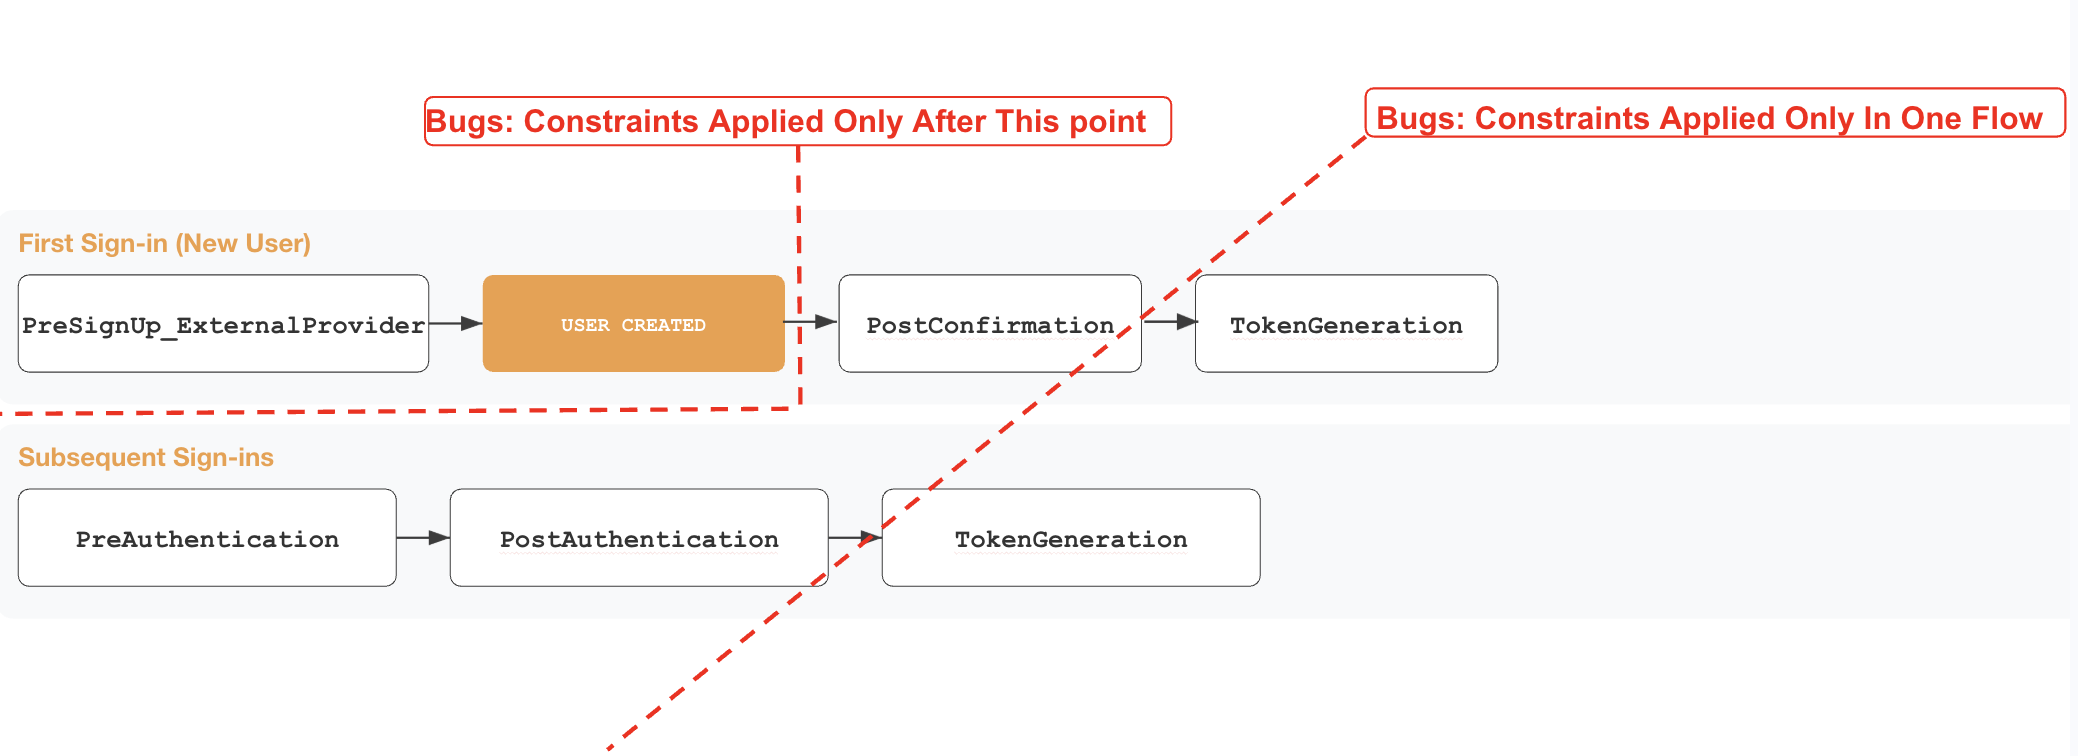
The main takeaways from a security perspective are:
PreSignup trigger is the only gate before the actual user object creation in the Cognito User Pool. Any identity landed in the pool could be interacted with by exploiting other features in the platformTokenGeneration trigger. Any authentication constraint applied only in one of the two chains might allow full authentication in the otherIn the example below we see what happens when an external OIDC IdP is involved, Cognito performs a full OIDC code flow, fetching /userinfo, and merging claims according to the setup defined at creation.
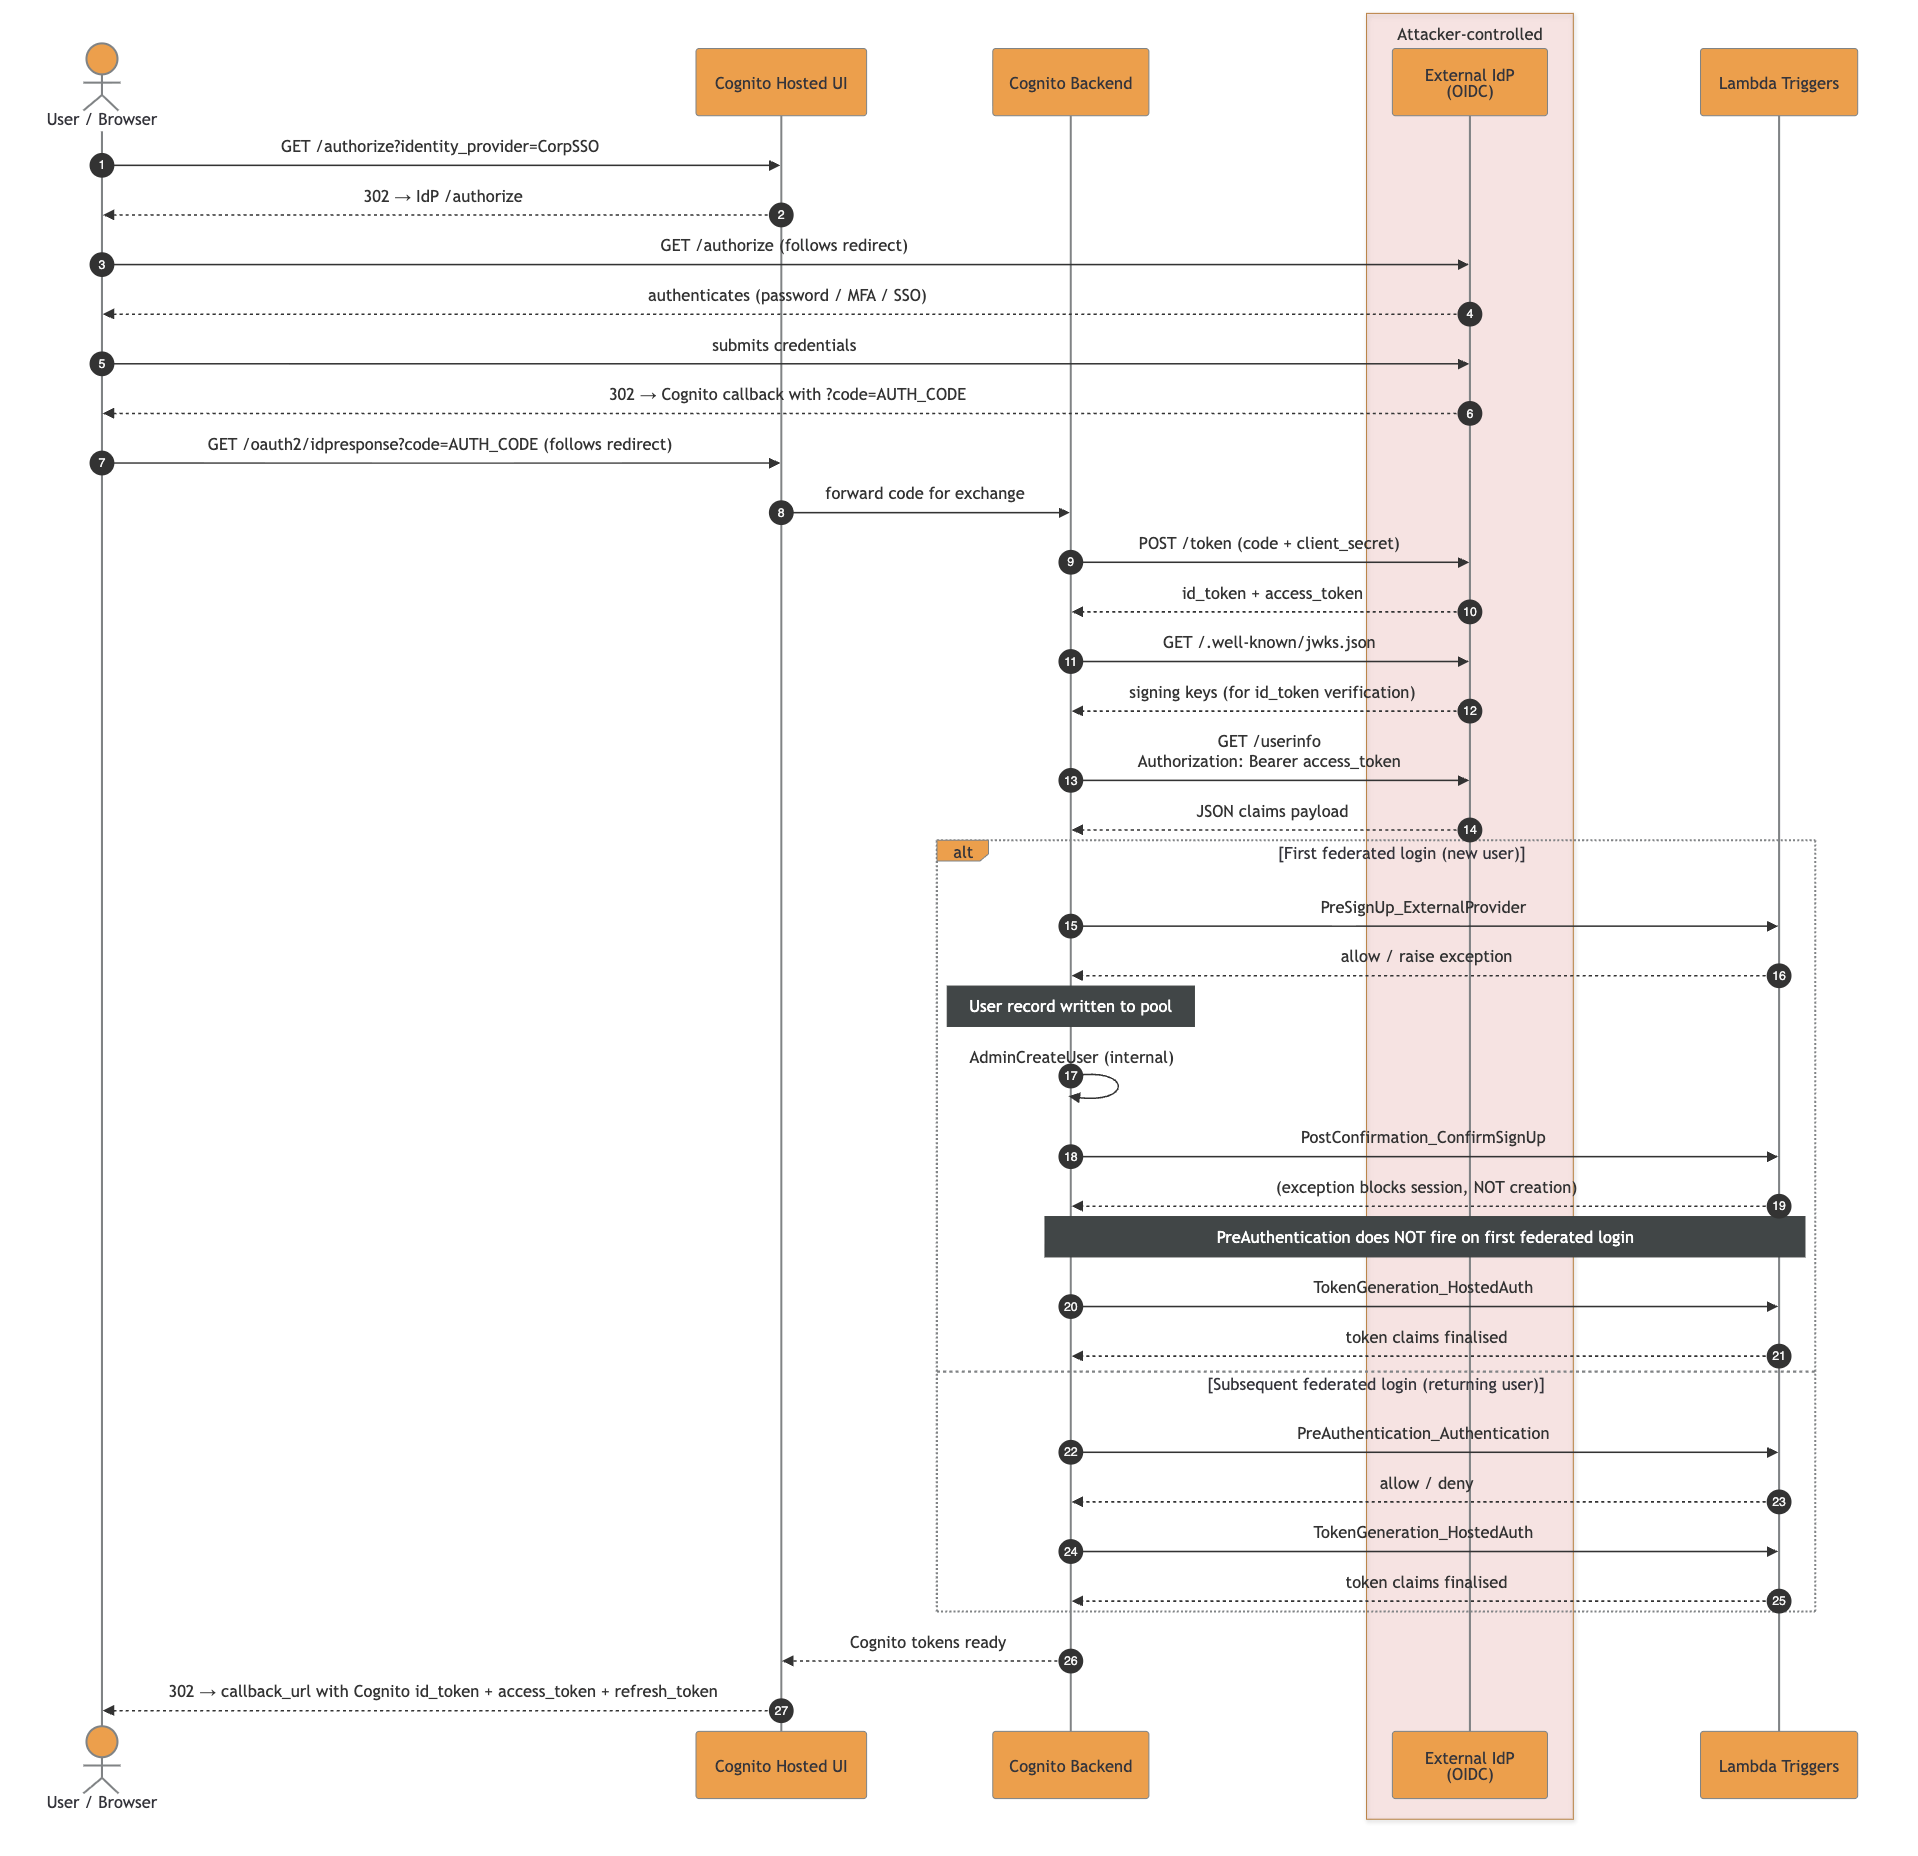
The high-resolution SVG file can be downloaded here.
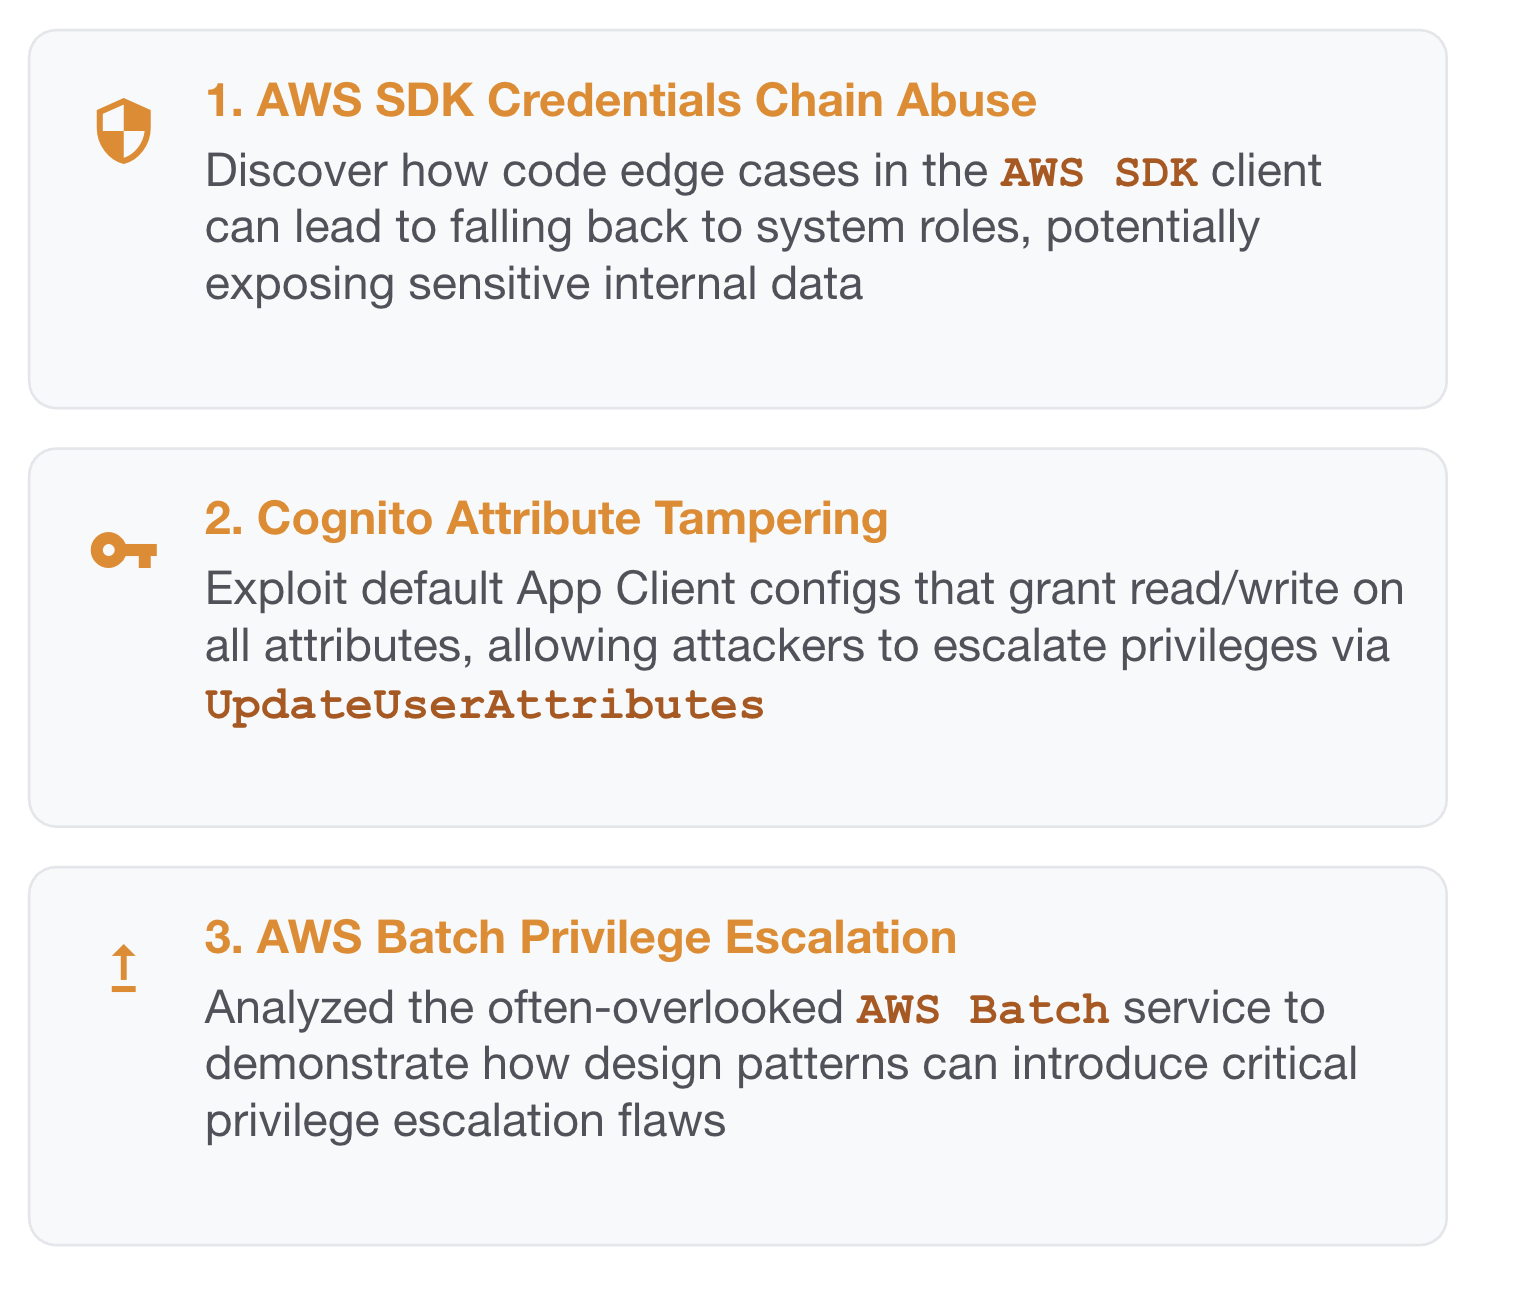
A malicious IdP could attack the platform relying on the multi-SSO Cognito User Pools in different ways, depending on constraints and the complex identity logic embedded in it.
Now we have everything: an extra injection point as malicious IdP talking to AWS Cognito, a set of complex triggers gluing together the labyrinth of identity constraints.
Let’s go through the possible anti-patterns that might introduce bugs:
As mentioned before, the trigger PreSignUp_ExternalProvider is the only one that fires before Cognito has persisted the user record in the pool.
Getting a ghost identity is straightforward most of the time:

Register a malicious OIDC server as an IdP (EvilCorp) using the self-service SSO config page
Federate with an attacker@company.com email
PreSignUp_ExternalProvider fires and does not include the domain check, hence Cognito persists the user record
PostConfirmation (the JIT provisioning Lambda) fires and the domain check throws, the session is blocked but the user record stays. PreAuthentication is configured with the same check too, but SSO is not the only way to interact with a user
From that point, even if there are rollback mechanisms that will delete it, you have an operational window where it is possible to abuse other features of the platform and interact with such identity. Worst case scenarios include a forceful password reset to gain non-SSO auth capability, impersonation of a user to get direct session and so on.
Tip: Weird escapes and other means of injections in other fields could lend you a vast range of vulnerabilities. Always review the components reading the identity object as a whole.
Cognito distinguishes creation and authentication paths through multiple event.triggerSource values. The triggerSource is the named info given to the custom handlers to understand the identity event and act consequently.
There are many values, some might get lost or misinterpreted by developers, introducing vulnerabilities.
The core values relevant to any multi-SSO security review are:
| triggerSource | When it fires / security risk |
|---|---|
InboundFederation_ExternalProvider |
fires before the user record is written on every federated sign-in, for new and returning users; skipping it means attribute checks fall to PreSignUp, which only fires on the first login |
PreSignUp_ExternalProvider |
fires when a first federated login would create a local user; missing id checks in it allow durable ghost identity |
PreSignUp_AdminCreateUser |
Usually fires on admin / SCIM creation paths |
PostConfirmation_ConfirmSignUp |
fires after confirmation, including auto-confirm on first federated login; cannot prevent user creation, only acts on an already-persisted record |
PreAuthentication_Authentication |
fires on subsequent logins only; does not fire on first federated login, so placing checks only there leaves first-login unprotected |
PostAuthentication_Authentication |
fires after every successful authentication but cannot block the session; detection and audit hook only, not a security gate |
TokenGeneration_Authentication |
fires on SDK/admin auth; different source from HostedAuth, logic applied to one is silently absent on the other |
The complete reference with every possible triggerSource lives in the Lambda triggers documentation.
Cognito’s internal identity key for federated users is not the email, it is:
<ProviderName>_<sub>
This appears as event.userName in triggers and as cognito:username in tokens. ProviderName is the IdP name registered in the pool and sub is the IdP subject identifier (attacker-controlled if the IdP is malicious).
Cognito enforces uniqueness on byte-equal ProviderName, but two IdPs whose names are visually similar but byte-distinct are accepted in the same pool.
As an example:
| Provider Name | Confusable codepoints | Rendering | Notes |
|---|---|---|---|
LegitCorp |
none (ASCII) | LegitCorp | baseline, accepted |
LеgitCorp |
е = U+0435 (Cyrillic small ie) |
LegitCorp | homoglyph "e", accepted on the same pool |
This is dangerous because most human-facing places do not surface the difference: Hosted UI buttons, audit logs, CLI output, and grep-based audits all just render Unicode and move on. Moreover, things could get even worse in case of parser differentials caused by an application then normalizes inconsistently (lower(), NFKC, etc.), it could end up with split identities for the same IdP, or lookups resolving to the wrong record.
The ProviderName regex forbids _. The sub claim does not. The complete identity string can therefore contain multiple underscores:
Corp_admin_override
If component A reads split("_", 1) and component B reads split("_")[-1] (or any other positional index), the same input produces two different meanings.
Sending sub = EVIL_noise_internal@company.com from the malicious IdP would result in:
| Lambda | Code | Index | Sees |
|---|---|---|---|
pre_signup (uniqueness guard) |
sub.split("_")[1] |
second token | "noise" not in pool, passes |
jit_provisioning (consumer) |
sub.split("_")[-1] |
last token | "internal@company.com", stored as custom:primaryEmail |
IdP identifiers are the strings Cognito uses for IdP redirection. The standard pattern is email-domain routing: a user types user@company.com, Cognito looks up company.com, and the browser is redirected to the IdP that owns that identifier.
Controlling an identifier effectively controls the initial redirection for all users of that identifier.
Hence, if a tenant drops or avoids registering an identifier, another IdP could claim it in the gap. As AWS Cognito does not ensure domain ownership, the platform itself should never allow claiming an idp-identifier without checking in advance that the tenant controls it.
It is a classic takeover of a domain with very dangerous outcomes. As an example, if gmail.com is claimable via a custom IdP configuration in a platform, you might end up redirecting every Google user to an attacker-controlled page.
Multi-SSO changes which triggers fire, what the application treats as the identity key, and how many attacker-controlled strings you accidentally parse as structure. A control placed on the wrong trigger creates ghost identities, a parser placed on attacker-controlled sub values creates privilege escalation, or a self-service IdpIdentifiers field creates a routing hijack window.
While reviewing a Cognito-backed multi-tenant platform, answer the following questions:
AttributeMapping? Anything in there is attacker-controlled if the IdP is malicious or compromised, regardless of WriteAttributes.PreSignUp Lambda branch on event.triggerSource? Does it cover PreSignUp_ExternalProvider and PreSignUp_AdminCreateUser, not just PreSignUp_SignUp?event.userName or cognito:username with something like split("_") and a positional index? If yes, the parser is fragile against sub values containing _ and you should look for a guard/consumer differential.IdpIdentifiers exposed in self-service IdP registration UIs? If yes, does the platform ensure that a domain id is being claimed by a tenant that confirmed its ownership? If not, arbitrary redirection of incoming users with unclaimed domains is possible.AttributeMapping mapping any security-sensitive custom attributes (e.g., custom:tenantID, custom:role, custom:isAdmin)? Even with WriteAttributes locked down, JIT Lambdas using AdminUpdateUserAttributes will write them.Place security gates in PreSignUp, branched per triggerSource. This is the single most impactful change for multi-SSO deployments. A working pattern:
def lambda_handler(event, context):
    if event["triggerSource"] in (
        "PreSignUp_SignUp",
        "PreSignUp_ExternalProvider",
        "PreSignUp_AdminCreateUser",
    ):
        enforce_domain_policy(event["request"]["userAttributes"]["email"])
    return event
Never do split("_") event.userName to extract identity. If you must parse it, use split("_", 1) (maxsplit=1) everywhere it is parsed. The guard and the consumer must use identical extraction logic, positional indices on attacker-controlled strings are a parser differential vulnerability waiting to happen.
Keep security-relevant custom attributes out of AttributeMapping. Derive tenantID and similar fields server-side from a verified email domain inside a trigger, never read them from event.request.userAttributes after federation.
Validate email strictly in PreSignUp.
For IdpIdentifiers: never expose them as a free-form field in self-service IdP registration. In IaC, register identifiers atomically. Do not “drop then add” in the same apply.
Almost every abuse described above assumes the same primitive: an attacker-controlled IdP that a Service Provider trusts, and the ability to tamper with the exact tokens, SAML assertions, and /userinfo payloads that reach it.
Running custom IdPs just for testing purposes was time-consuming, so we decided to release the one we use during pentests: doyensec/maSSO
maSSO is a weaponized compliant Single Sign-On (SSO) Identity Provider (IdP) for security testing of OIDC and SAML 2.0 Service Providers, also supporting the SCIM protocol.
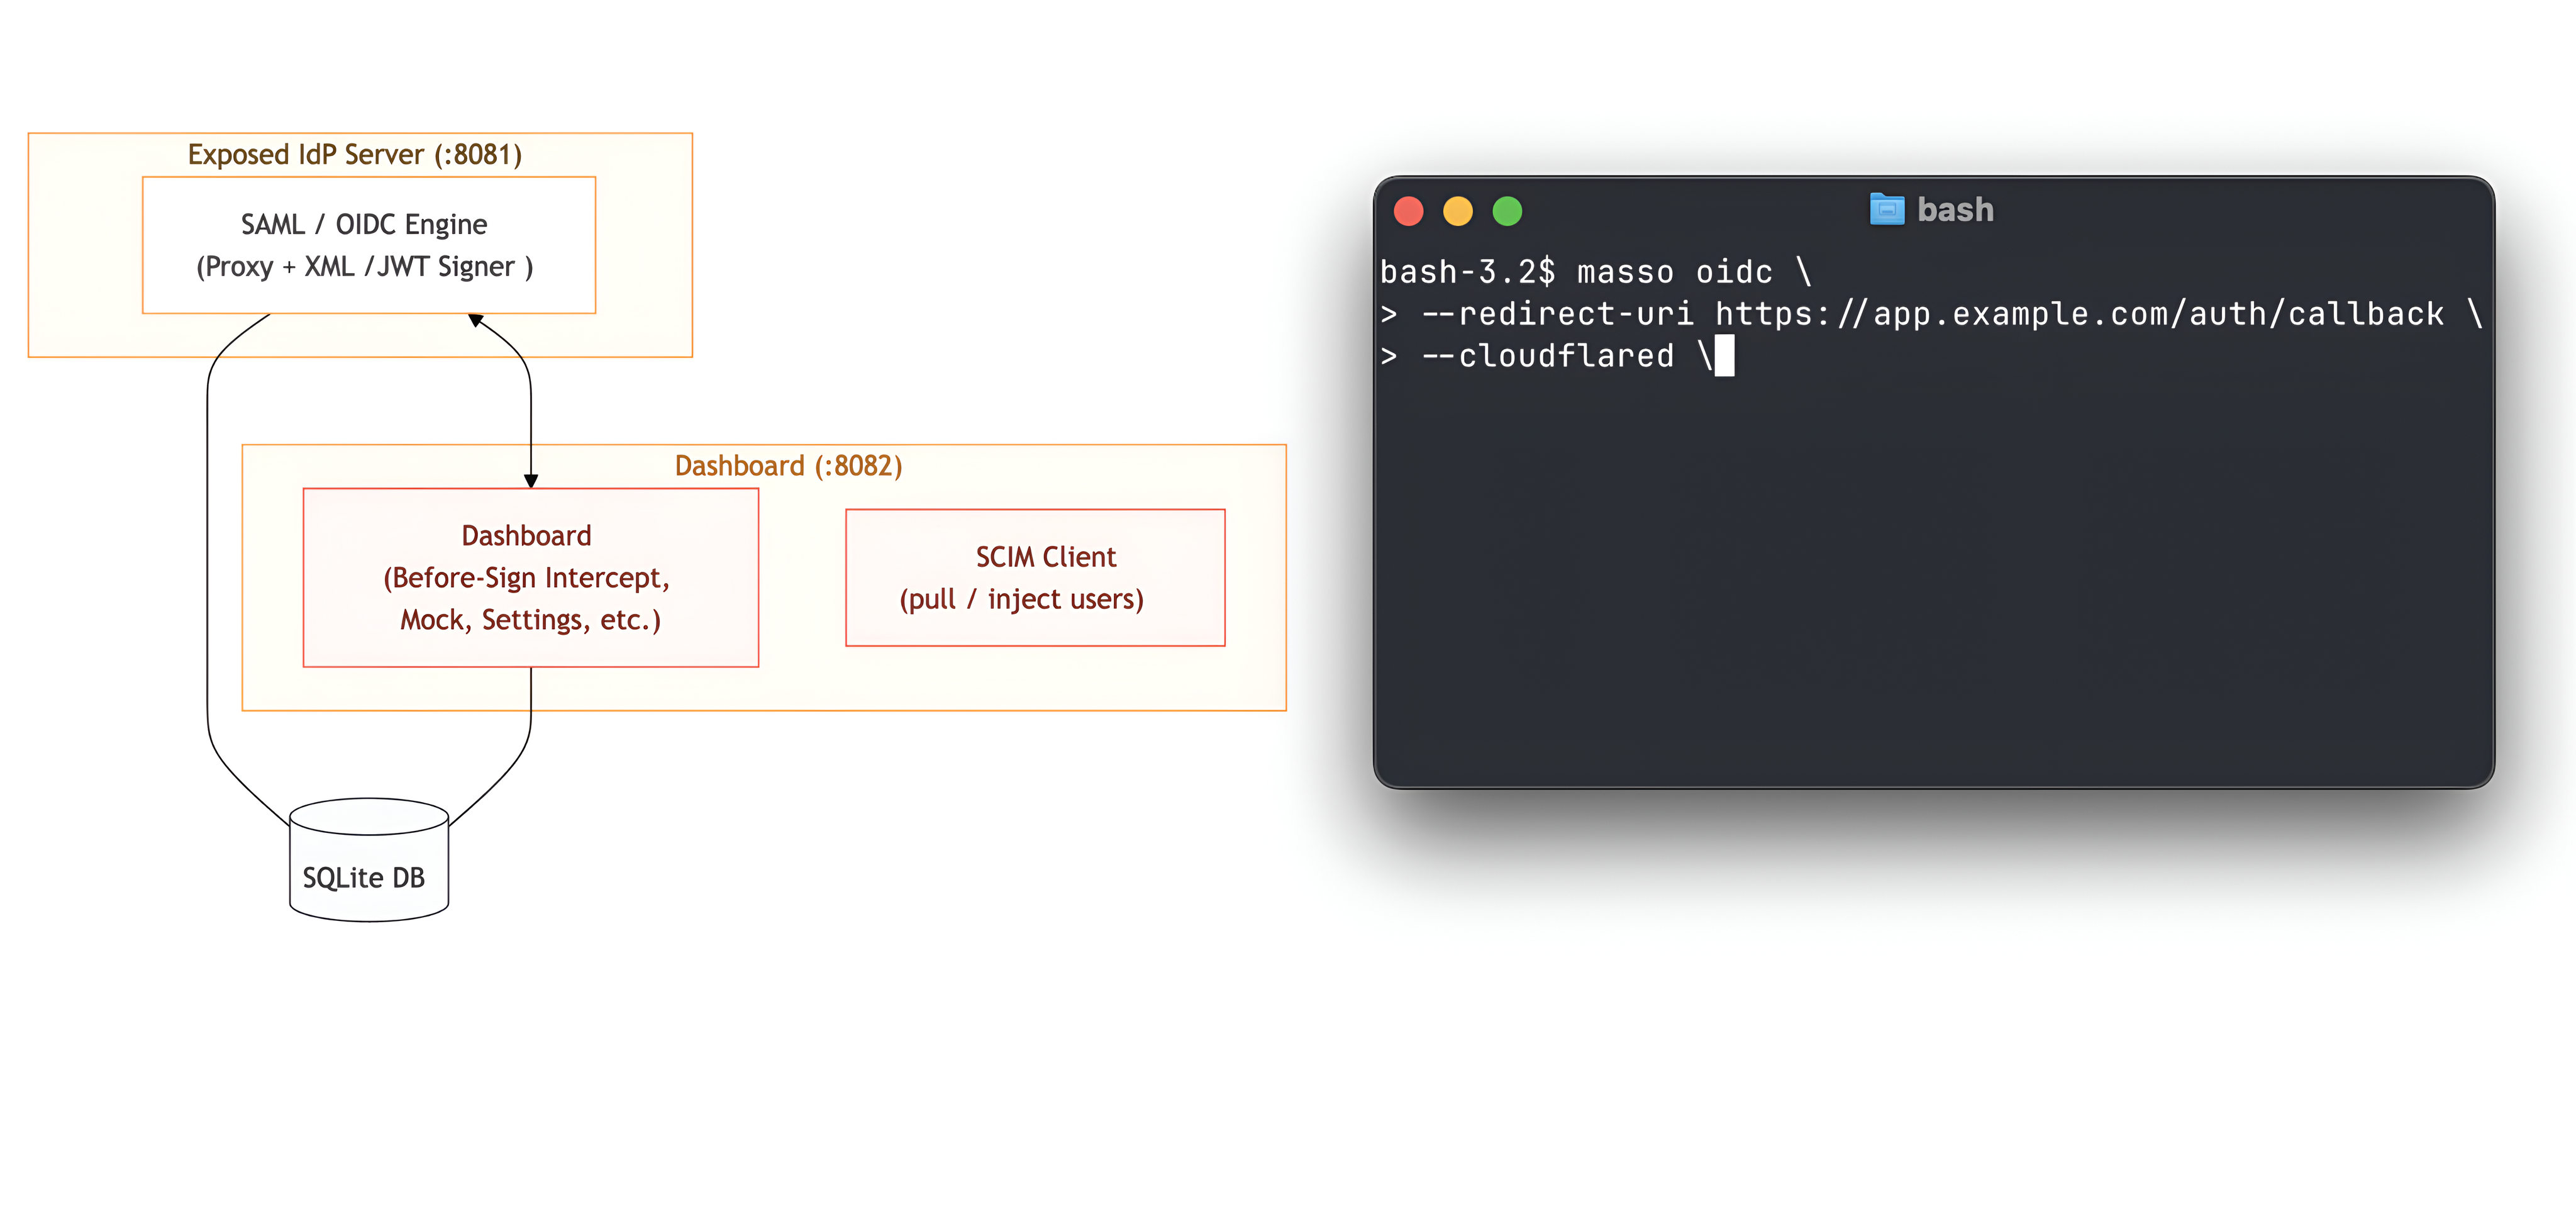
For us, it was the missing Swiss Army knife for actual SP testing. Let us know your feedback!
As promised in the series’ introduction, we developed a Terraform (IaC) laboratory to deploy a vulnerable dummy application and play with the vulnerability: https://github.com/doyensec/cloudsec-tidbits/tree/main/lab-masso
Stay tuned for the next episode!
Have you ever wondered how those amazing space photos are taken? Are they exclusive to the big telescopes floating in space or can you take one from your backyard? What does it take to extract hydrogen colors out of a seemingly black sky?

Those are great questions, but you won’t learn it from here.
Instead, I’ll show how I set up and performed fuzzing of the CFITSIO library which is how those space photos are usually processed. I’ll show how the bugs were triaged at scale, and how Codex was used to unblock the fuzzing and to develop the initial security fixes.
Note: the work described in this blogpost used the GPT-5-Codex, which was the latest model I had access to at the time.
The Flexible Image Transport System (FITS) is a data standard created in the late 1970s by NASA, ESA, and the broader astronomy community. It started as a way to exchange telescope imagery across heterogeneous systems, but it evolved into a container for complex datasets: primary images, binary/ASCII tables, compressed tiles, world coordinate metadata, and instrument-specific headers. Today, most observatories, satellite missions, and even backyard observatories output FITS directly, so the ecosystem of tools is rich. Under the hood, FITS is far more than a simple image file - it routinely carries gigabyte-scale mosaics, time-series cubes, and calibration tables. The current FITS standard lives in a dense spec and most of it addresses astronomy beyond typical astrophotography - radio, infrared, X-ray, time-series, and polarization data with all their metadata are first-class in the spec, while backyard imaging uses only a small slice. Once telescopes and CCD cameras got cheap enough for hobbyists, the community needed tooling that already worked, so adopting FITS was the obvious shortcut. The format was battle-tested and carried all the metadata serious imaging needed. Ultimately, hobbyists inherited a rather complex data format that rarely changes because backward compatibility with old files is still mandatory.
There are several different libraries that claim to support the FITS format. Usually though, that only means some subset of the spec. CFITSIO is the most complete implementation and the library is used by numerous great pieces of astronomy software, therefore it piqued my interest.
For my fuzzing corpus, I’ve used some of my own astrophotos along with several public samples. I’m sure the coverage could be vastly improved with the right set of specialized data.
Initially, I began fuzzing using the standard AFL++ workflow. Harness code, testing corpus, some optimizations, with several sessions running over two weeks. This resulted in a security advisory consisting of six different bugs.
It was a quick experiment to see how fruitful the fuzzing could be and how the communication with the NASA team works. Fortunately, the cooperation was great and issues were quickly addressed by the HEASARC team.
Having the setup ready to go, I decided to give it another shot. Testing was performed against cfitsio-4.6.3 which included fixes to previously reported issues. This time, I focused exclusively on the Extended Filename Syntax (EFS) which got my interest earlier. It’s a set of filters, enclosed in square brackets, that can be used to modify the raw file in various ways before it is opened and read by the application. Although EFS looks like a filename parser on the surface, it’s effectively a mini-language: image slicing, histogram generation, filters, pixel expressions, region filtering, arithmetic expressions, and the entire parser stack behind them.
An example FITS filename can look like this: myfile.fits[EVENTS][col Rad = sqrt(X**2 + Y**2)]
This opens a FITS file, selects the EVENTS extension, and creates a new column computed from existing data. The library does all of that before the application sees a single byte. The filename alone triggers extension lookup, column arithmetic, and a temporary file copy. Each bracket pair activates a different parser subsystem inside CFITSIO.
This represents a very interesting attack surface and it’s exposed in more places than people might think. Many applications accept filenames directly from external callers without realizing that CFITSIO will interpret them through EFS if only the fits_open_file or similar method is called (a non-EFS alternative: fits_open_diskfile also exists). If those filenames come from untrusted input, the attack path is open.
This time, as I didn’t have too much dedicated time, I’ve strongly relied on help from the GPT/Codex. First, it generated the harness code and some helpful cleanup utilities. The harness itself is minimal: it reads a filename string from a file, passes it to fits_open_file in read-only mode, then exits. That’s enough to exercise the entire EFS parsing and evaluation pipeline (or most of it, as I learned later), without needing complex application logic.
Early fuzzing cycles not only resulted in a lot of crashes, but also unexpected files created all over the filesystem and with the input FITS file being repeatedly destroyed. This wasn’t hard to fix though. I then asked GPT to look at the spec and the code and create a dictionary tailored to EFS tokens.
Within hours I had some clean crashes. This was nothing surprising given how much logic CFITSIO runs before it ever opens a file. Some days later, I ran AFLtriage and observed that there are just three different bugs responsible for all crashes I was seeing. The fuzzer couldn’t move on any further and coverage also barely moved. Even relatively simple code paths were unreachable with random mutations constantly hitting the same shallow error paths.
To keep going, I had to automate more of the workflow. That’s when I brought in Codex again.
I loaded the CFITSIO/harness sources into Codex and fed it the crash reports along with the input files. Within seconds, it identified the root cause of each issue. It also gave me correct functions, correct offsets, correct control flow, and assumptions that failed. It pointed to actual logic errors, such as operator-precedence mistakes, unchecked token lengths or unbounded concatenations. I was surprised how fast and accurate the analysis was.
The next step involved asking for the patch and applying it. This completely unblocked my fuzzing. I restarted the process using the old output directory with a new harness build and… left it running.
Two weeks later, I had to stop the fuzzing and started investigating. AFLtriage again was very useful to quickly identify unique crashes. Learning from past experience, I went with Codex as my assistant again. After a few manual experiments I automated the following pipeline:
Some fixes required multiple iterations. A patch that fixed an overflow might introduce a memory leak or leave an error path inconsistent. The automated loop caught those kinds of bugs. With just one verification test, it’s extremely likely that some functional issues were introduced. On the other hand, I skimmed the patches and they looked really solid, so… maybe not?
I repeated this process from scratch several times and ended up with 16 unique vulnerabilities, each pretty well understood, reproduced, and isolated.
Most of the bugs were from the old-school C string handling meets attacker-controlled input category. Some mismatched size checks on strncat, some stale realloc pointers, and some integer overflows in array math. This led to overflows on the stack and heap.
I did not attempt to weaponize any of the findings. CFITSIO might be used on so many platforms that some of them definitely miss even the most basic security mitigations. On the other hand, a quick inspection of stack overflows led me to believe that function frames are enormous and reaching control over RIP, or any function pointer, might be really challenging.
Here is a brief overview of one of the findings (CFITSIO-EFS-01). It’s a typical syntax trap that most people will overlook but fuzzing should easily find.
In the Extended Filename Syntax, row filter expressions are encoded inside square brackets, like file.fits[2:f[R:f...]. The function ffifile2 accumulates them into a stack buffer called rowfilterx. Before each concatenation, it checks whether the new chunk would overflow the buffer:
if (strlen(rowfilterx) + (ptr2-ptr1 + (*rowfilterx)?4:0) > FLEN_FILENAME - 1) {
    free(infile);
    return(*status = URL_PARSE_ERROR);
}
Looks reasonable at a glance. There’s even a comment above it: “add extra 4 characters if we have pre-existing expression”. The intent is clear: if rowfilterx already holds something, the code wraps the new piece with ((...)), so it needs 4 extra bytes.
The problem is C operator precedence. The ternary ?: has lower precedence than +, so the expression actually evaluates as:
(strlen(rowfilterx) + (ptr2-ptr1 + (*rowfilterx)) ? 4 : 0) > FLEN_FILENAME - 1
That whole left side of ? is always non-zero (it’s a positive length sum), so the result is always 4 > FLEN_FILENAME - 1, which is always false. The if statement is never entered. Crafted filenames bypass it and strncat writes past rowfilterx, corrupting adjacent stack data.
The fix is just parentheses:
if (strlen(rowfilterx) + (ptr2 - ptr1 - 1) + ((*rowfilterx) ? 4 : 0) > FLEN_FILENAME - 1) {
This is the kind of bug where the developer clearly knew what they were protecting against. Yet, they got busted. It’s also a perfect example of what makes the Codex-assisted debugging effective. I handed it the crashing input, the ASAN trace, and the source file. Given those, it pinpointed the precedence issue right away.
On November 17, 2025, the complete package — advisory, patches, crash files, and reproduction steps - was sent to the HEASARC/NASA maintainers. All code patches were Codex-generated. Since I don’t have access to a sufficient representation of real-world FITS files, I couldn’t validate functional regressions myself outside of a couple of test cases.
Once the security fixes landed in the repository, the team confirmed that the patches were very useful and even in the cases where ultimate fixes differed from the provided patches, they were still helpful to illustrate the problem. Some of them were applied without any changes.
The full advisory can be found here.
Combining AFL++ with automated static guidance and automated fix validation proved to be very effective on a complex, legacy-heavy codebase and saved me a ton of time. I’m also happy that the HEASARC/NASA maintainers found the patches useful.
For the time being, I do not intend to continue CFITSIO fuzzing. Sadly, I believe there are still numerous memory issues lurking in old codebases like this. I hope that emerging security-oriented LLMs will be especially useful for identifying and fixing issues in projects appearing to the community as less interesting than the next major browser or CMS.
The story is not over yet though. Besides the memory issues presented in this post, separate logical bugs in EFS were discovered and will be soon disclosed. Stay tuned!
In other news, I will be presenting more about NASA’s CFITSIO Extended Filename Syntax at BSidesLuxembourg 2026. See you there!
This article shares our perspective on the current state of authentication and authorization in enterprise-ready, remote MCP server deployments.
Before diving into that discussion, we’ll first outline the most common attack vectors. Understanding these threats is essential to properly frame the security challenges that follow. If you’re already familiar with them, feel free to skip to the section “Enterprise Authentication and Authorization: a Work in Progress” below.
Huge shoutout to Teleport for sponsoring this research. Thanks to their support, we have been able to conduct cutting-edge security research on this topic. Stay tuned for upcoming MCP security updates!
At this stage, introducing the Model Context Protocol (MCP) would be redundant since it has already been thoroughly covered in the recent surge of security blog posts.
For anyone who may have missed the conversation, here’s a brief recap:
MCP is a protocol used to connect AI models to: data, tools and prompts. It uses JSON-RPC messages for communication. It’s a stateful connection where clients and servers negotiate capabilities.
A high-level architecture is provided below:
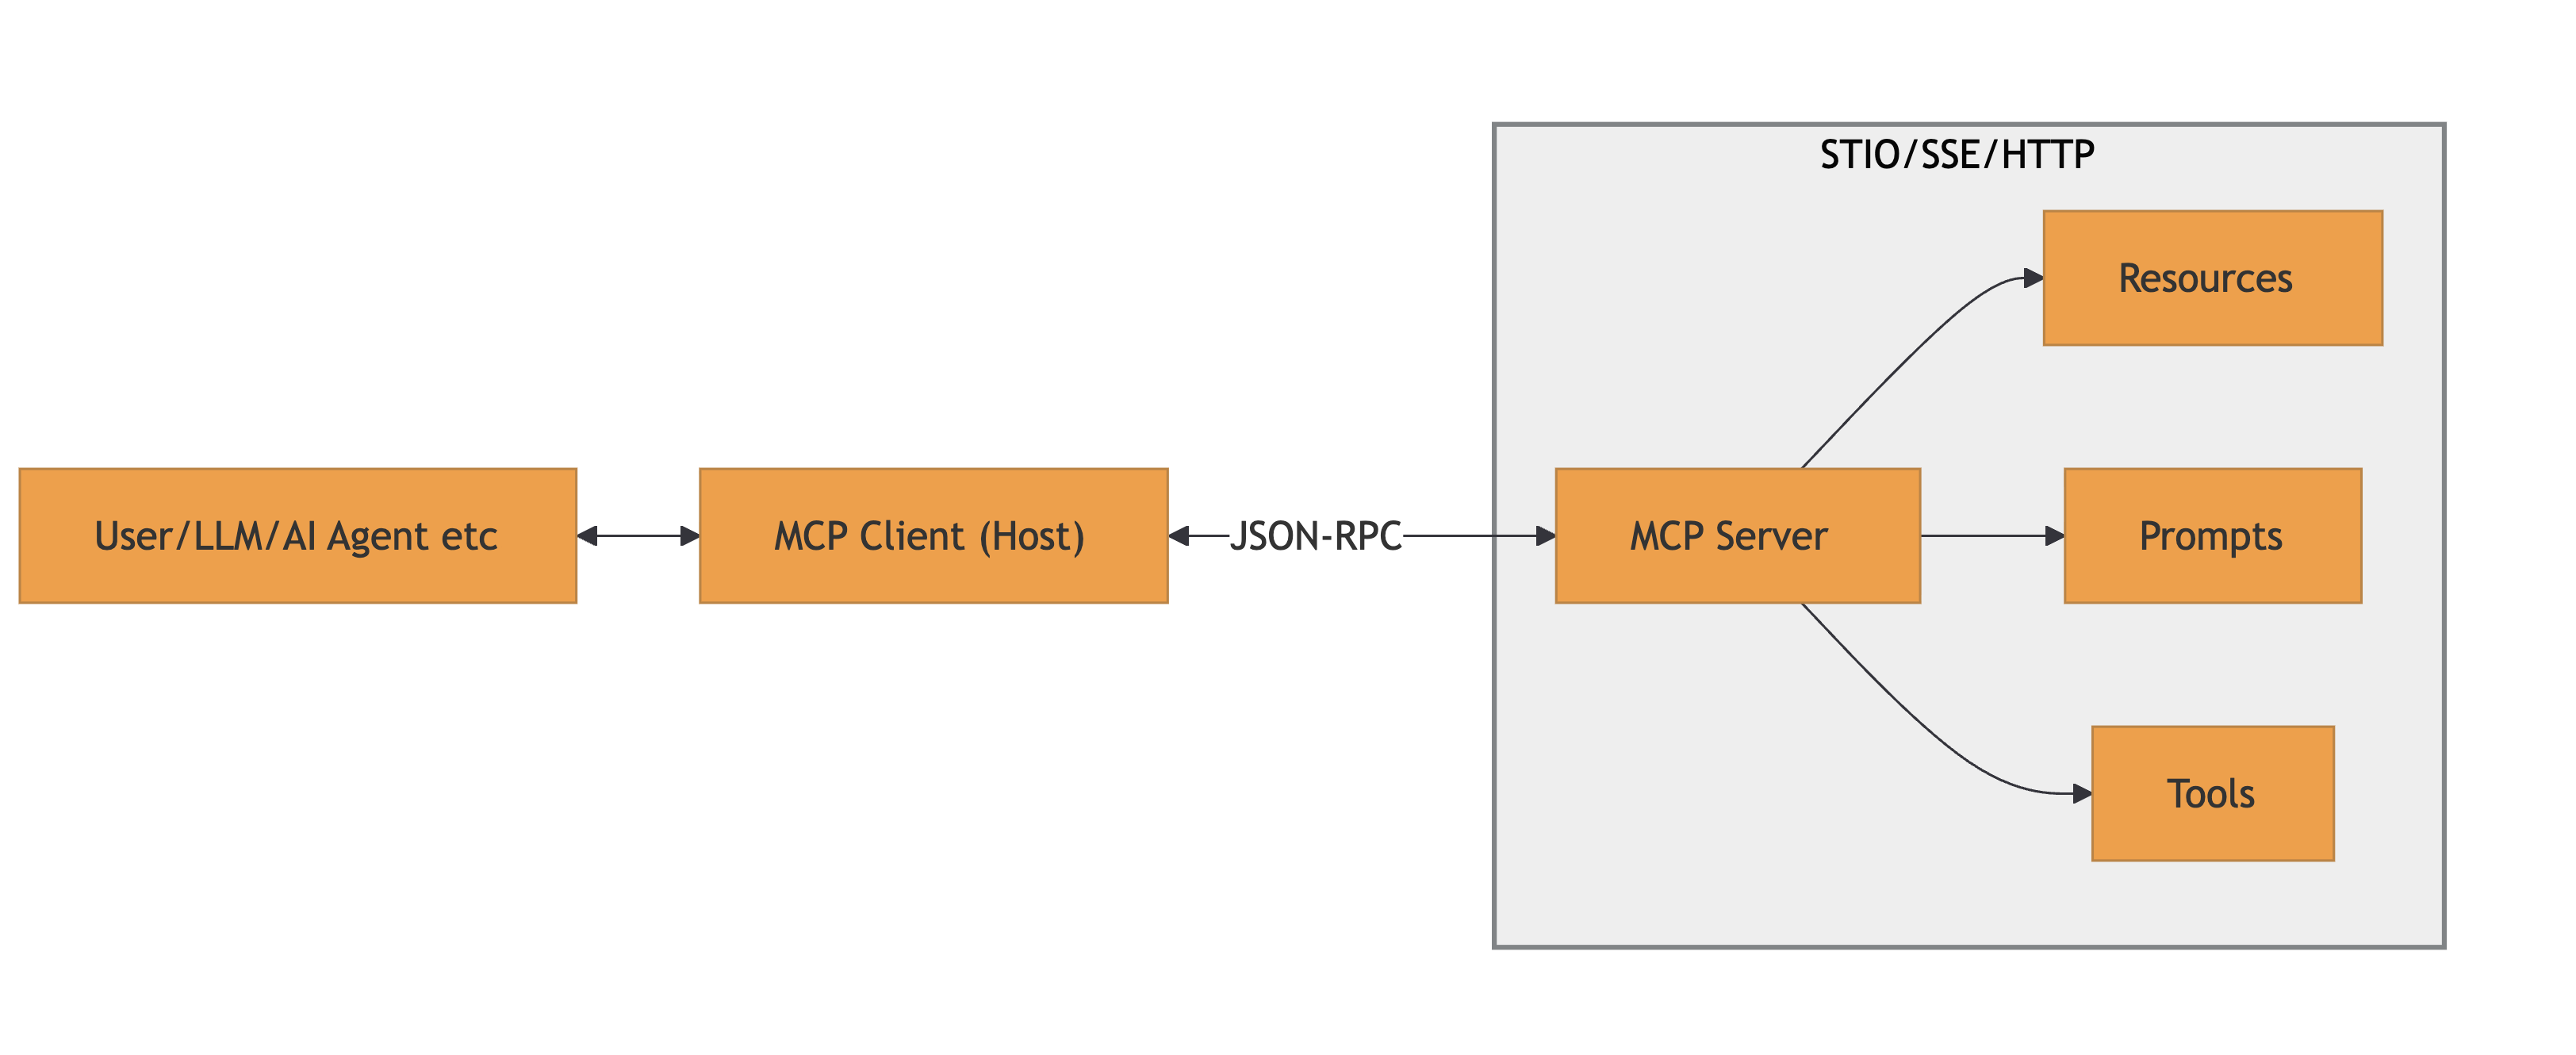
References: MCP Specification and MCP Architecture
Several categories of vulnerabilities pertaining to MCP emerged in the wild. While it might not fit every bug you read about, as things are changing on a daily basis, a good starting point is the good and not-so-old OWASP MCP Top 10.
Below are the most relevant vulnerabilities we have encountered so far, organized by the malicious actor profile:
Rogue MCP servers could intentionally exploit clients with:
tools/list call, then switches to malicious ones during execution or in subsequent MCP messagesIt should be highlighted that the the listed attacks are exploitable by either local or remote MCP servers. Of course, the outcome varies drastrically in terms of achievable impacts.
Rogue MCP clients could intentionally exploit servers with:
CVE-2025-53100 (RestDB’s Codehooks.io MCP Server), CVE-2025-53818 (GitHub Kanban MCP Server)Beyond the traditional client-server factors, an MCP ecosystem could also be compromised by:
.well-known/oauth-authorization-server) and dynamic client registration. Malicious actors could exploit these intermediaries by injecting fake metadata, manipulating redirect URIs, or compromising the registration endpoint to obtain unauthorized client credentials (e.g., CVE-2025-4144 - a PKCE bypass in workers-oauth-provider, CVE-2025-4143 - improper redirect_uri validation)Securing SSO remains an open challenge for the industry due to its intrinsic complexity. The past few years have highlighted this reality, with a steady stream of severe vulnerabilities affecting OAuth2, OIDC, SAML and SCIM implementations.
Yet, progress never stops and authentication & authorization in MCP are the new inevitable nightmare. Being a relatively new protocol, the standards for how clients and servers should establish trust are still evolving, leading to a fragmented ecosystem.
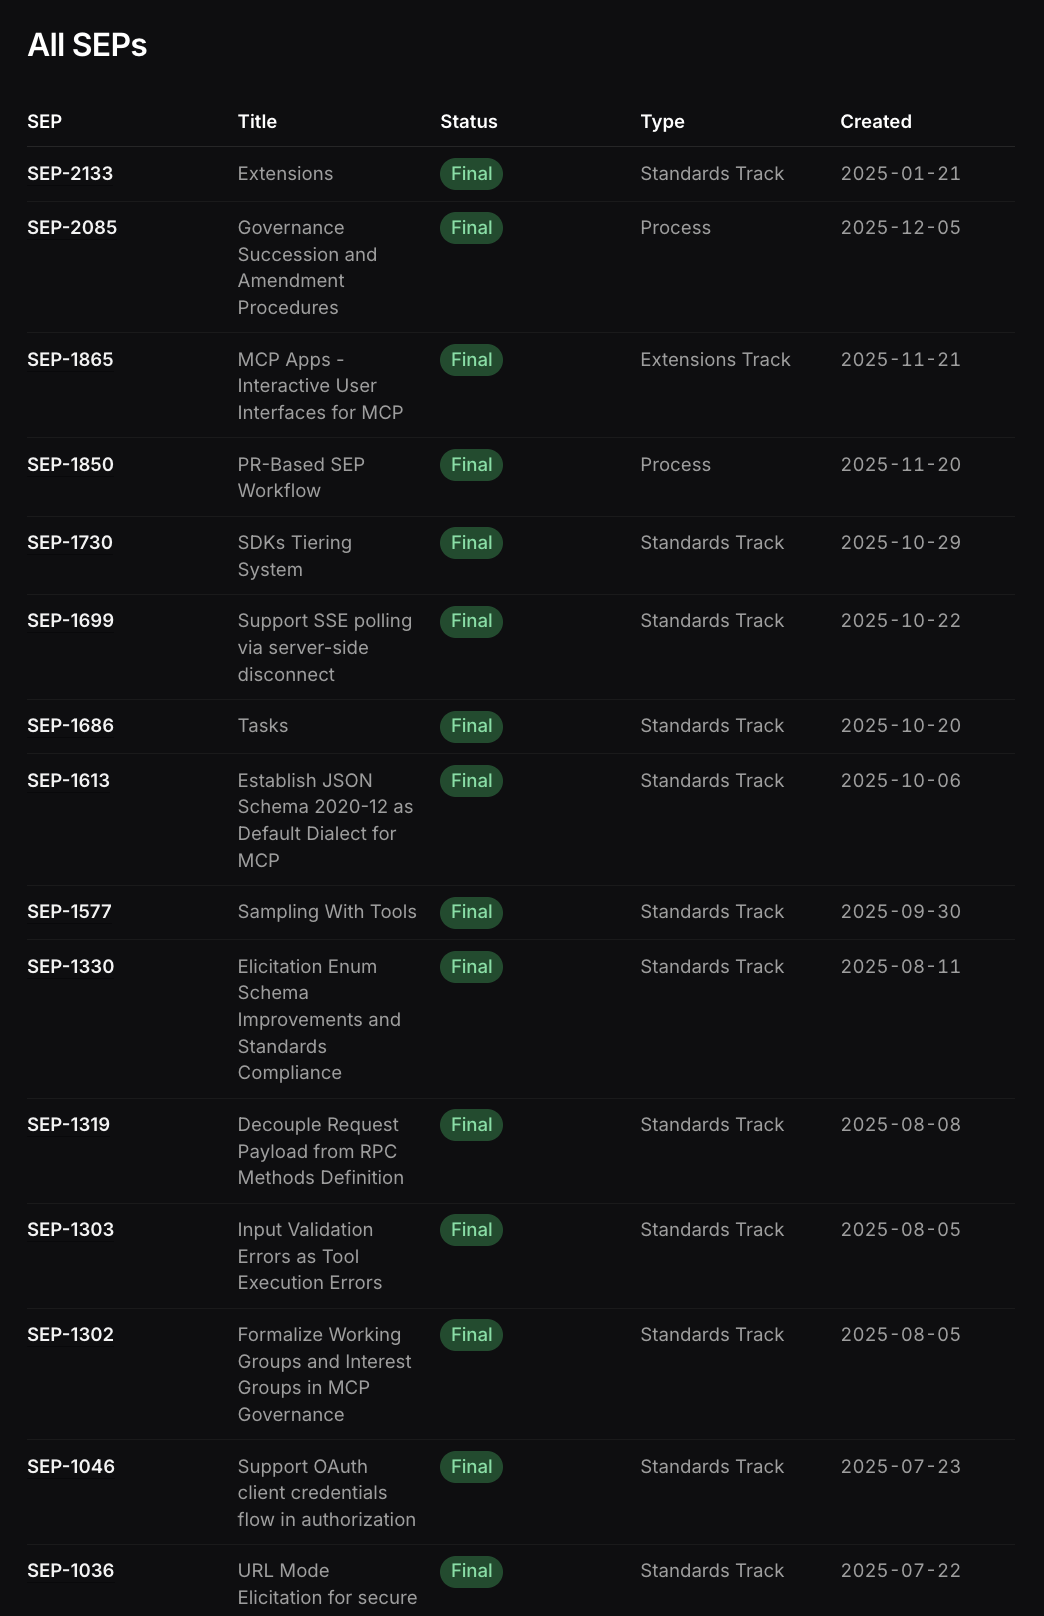
The specifications for AuthN/AuthZ are subject to continuous changes and extensions, as is common for newborn protocols. This instability means that today’s “secure and compliant” implementation might be deprecated or insufficiently secure tomorrow.
Just few of the latest Specification Enhancement Proposals (SEPs) in MCP
Multiple significant issues have been emerging in the MCP SSO implementation, many as descendants of the common OAuth2/OIDC vulnerabilities, but also new ones.
We have seen browser-based clients or open() URL handlers exploited to launch arbitrary processes or redirect to malicious servers, showing the fragility of the MCP client-side implementation, often linked to automatic action executors.
Then, attacks against the new metadata discovery and old-school metadata endpoints:
Notable mentions around the cited scenarios are: CVE-2025-6514, “From MCP to Shell”, CVE-2025-4144, CVE-2025-4143, CVE-2025-58062
Furthermore, many implementations (like IDE extensions and CVE-2025-49596) assumed localhost was secure, starting WebSocket servers without auth, allowing any local process (or malicious website via DNS rebinding) to connect.
While keeping up with the latest news is pretty complex, time consuming and not always possible, we attempted to sum-up the potential injection points affecting the current MCP Authentication via OAuth2 and dynamic client registration.
The monolith sequence diagram below embodies the title of this post. It should serve as a reminder of how extensive the attack surface is and how many injection points exist. One could argue that “every step is an injection point” and that would not be inaccurate. However, the goal here is to illustrate the full length of the authorization flow, from start to finish, highlighting the many branches, variations, and opportunities for subtle yet impactful vulnerabilities.
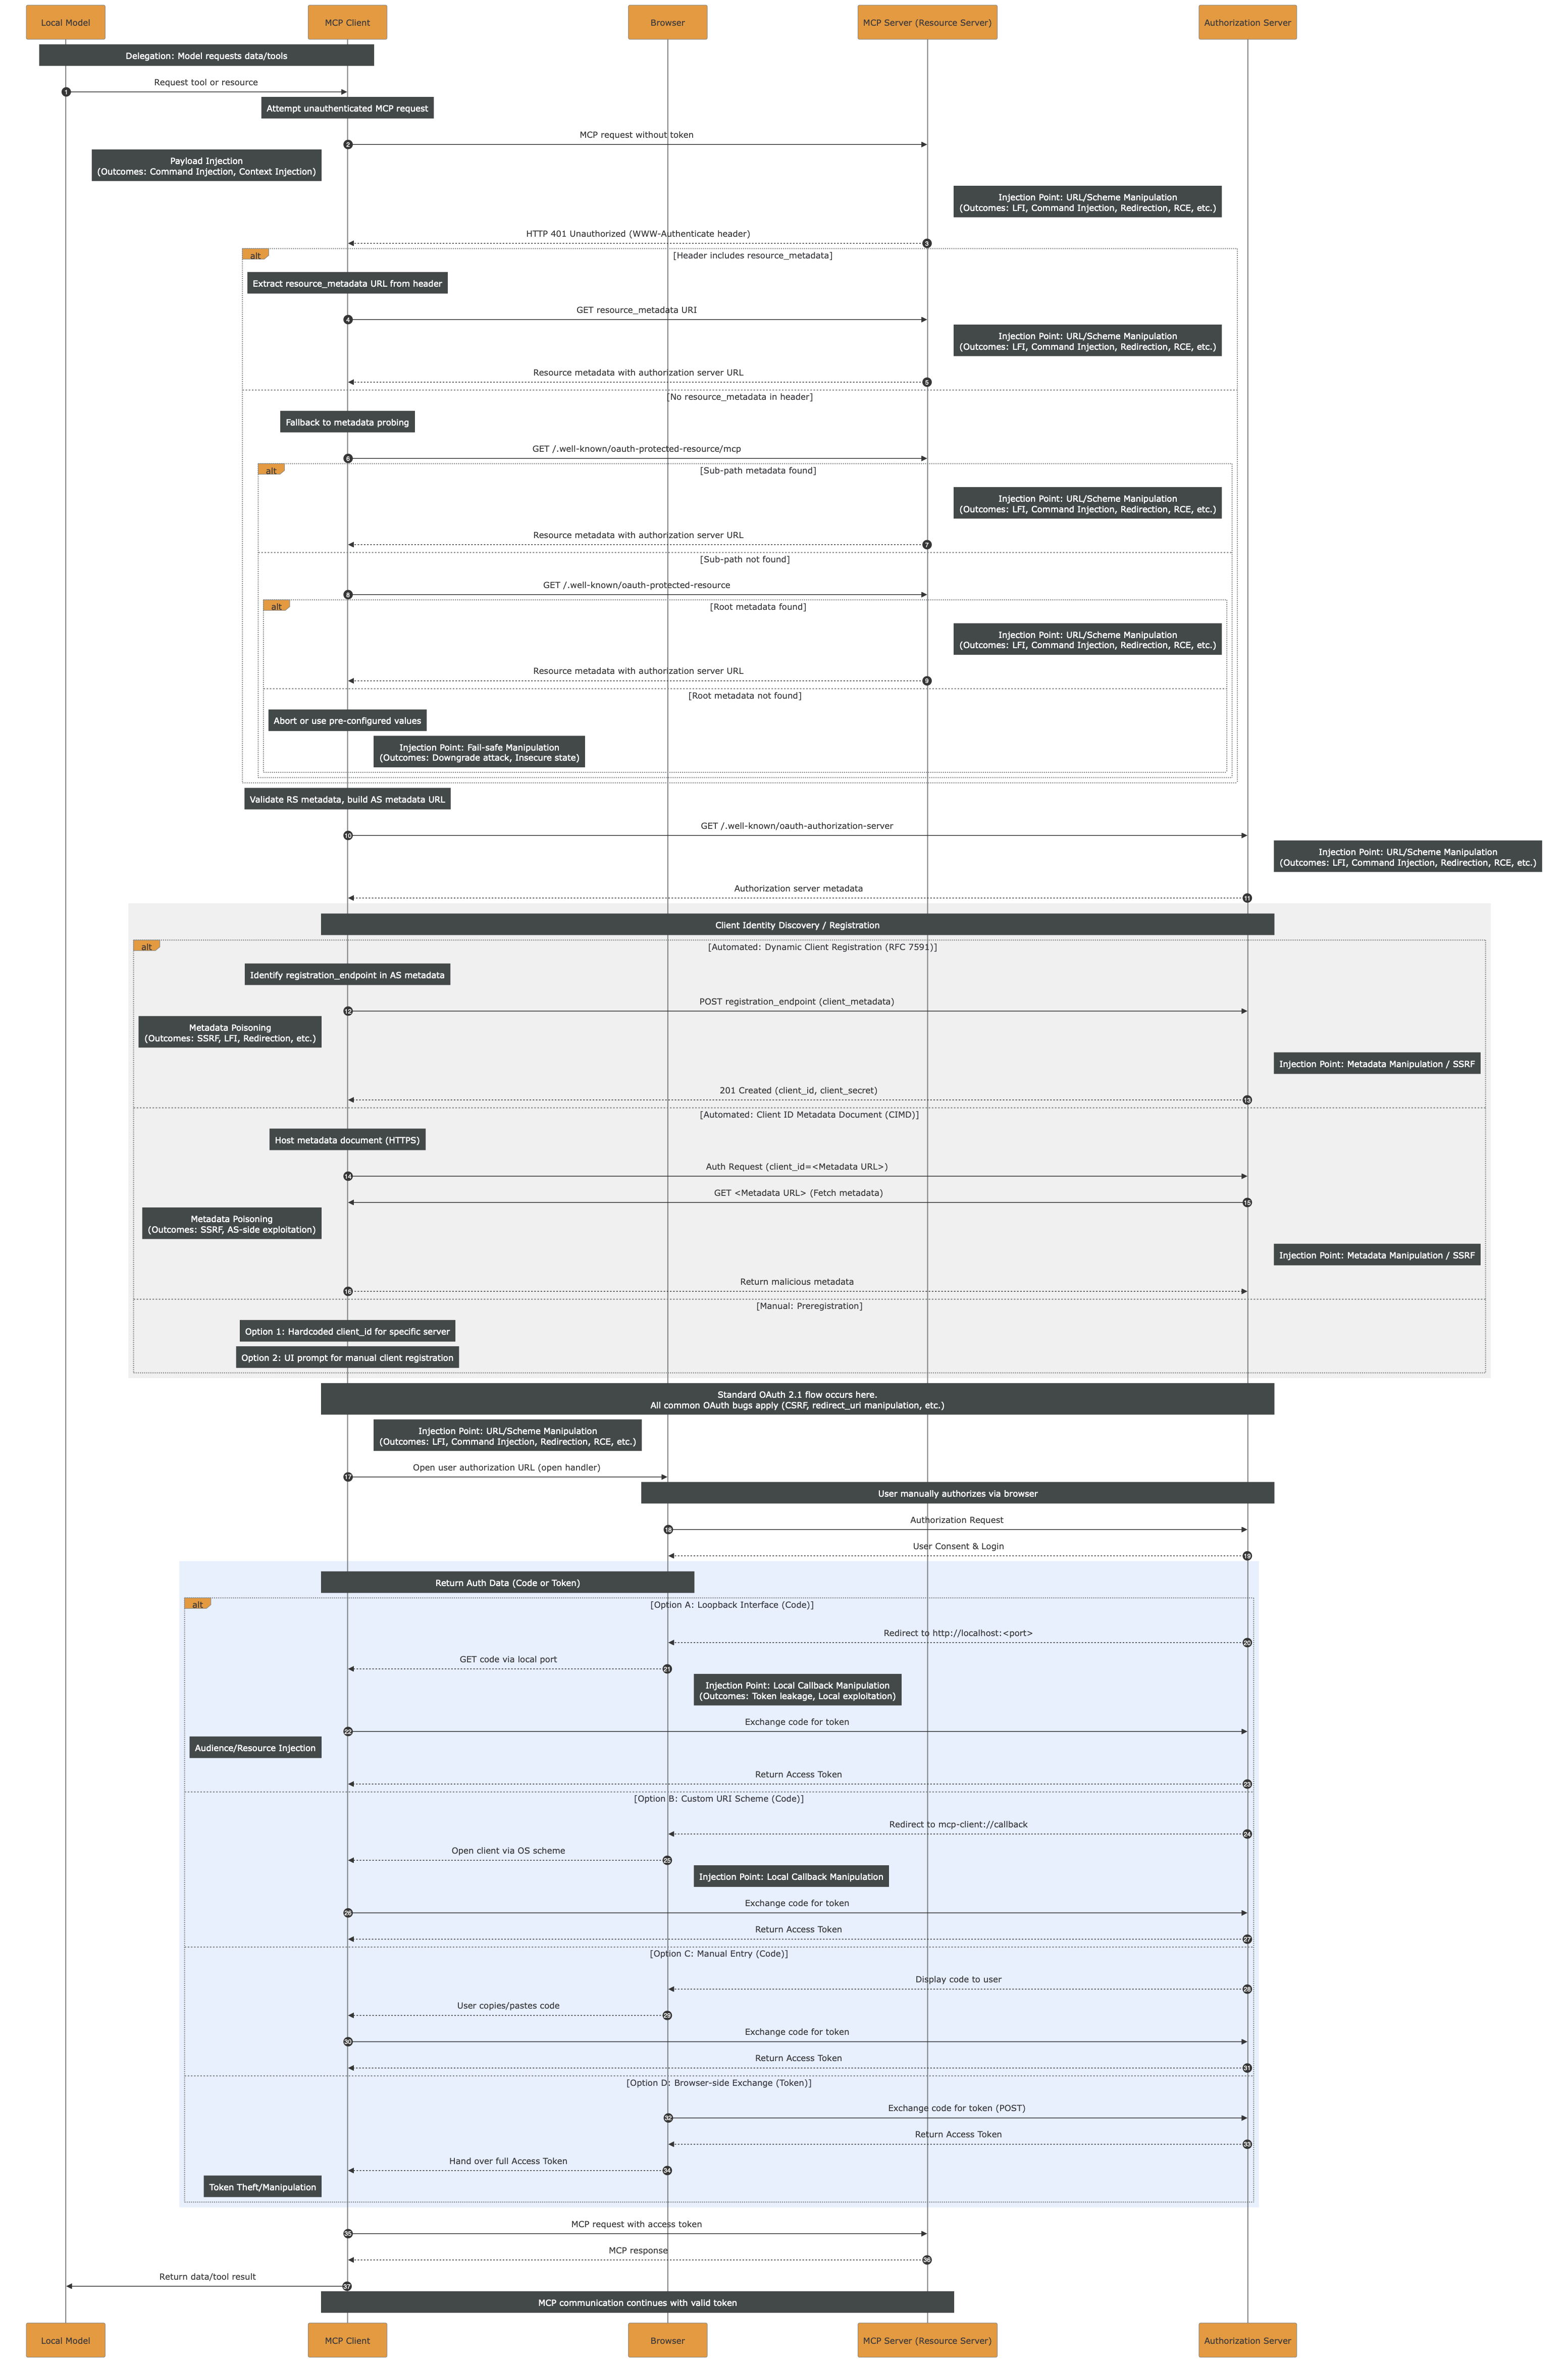
The high-resolution PDF file can be downloaded here.
While prompt injection requires a different approach, most of the injection points and impactful outcomes, such as LFI, RCE, etc. could be prevented by strictly applying sanitization and validation of the inputs. Still, the monolith highlights how complex it is to do so, given the length and variety of actors throughout the entire flow.
In the OAuth specification, there is scope consent by the user at the time of authorization.
The user HAS to see and approve the exact scopes for each third-party tool/app/etc. before any token is issued by the IdP.
Currently, there is no homogeneous way to manage MCP security across an enterprise. While individual MCP tools struggle with authentication and often just rely on secret tokens, the Enterprise-level authN/Z is a whole other challenge.
In fact, in enterprise-managed authorization the scope consent is decoupled from the time of authorization.
As an example, an MCP client with enterprise authorization could be accessing Slack and GitHub on behalf of the user, but the user never explicitly consented to
github:readslack:writein a consent screen. The local agent decided the task and the scopes required, and the enterprise policy enforcement decided to allow it on behalf of the user based off their MCP Client identity.
Down that path, there is intermediary tooling trying to offer a partial solution such as MCP Proxies/Gateways. While they are extremely useful at aggregating MCP severs under the same centrally-managed authentication and authorization layer, they are still not solving the problem rising with dynamic scopes and plug-and-play third-party tools/apps.
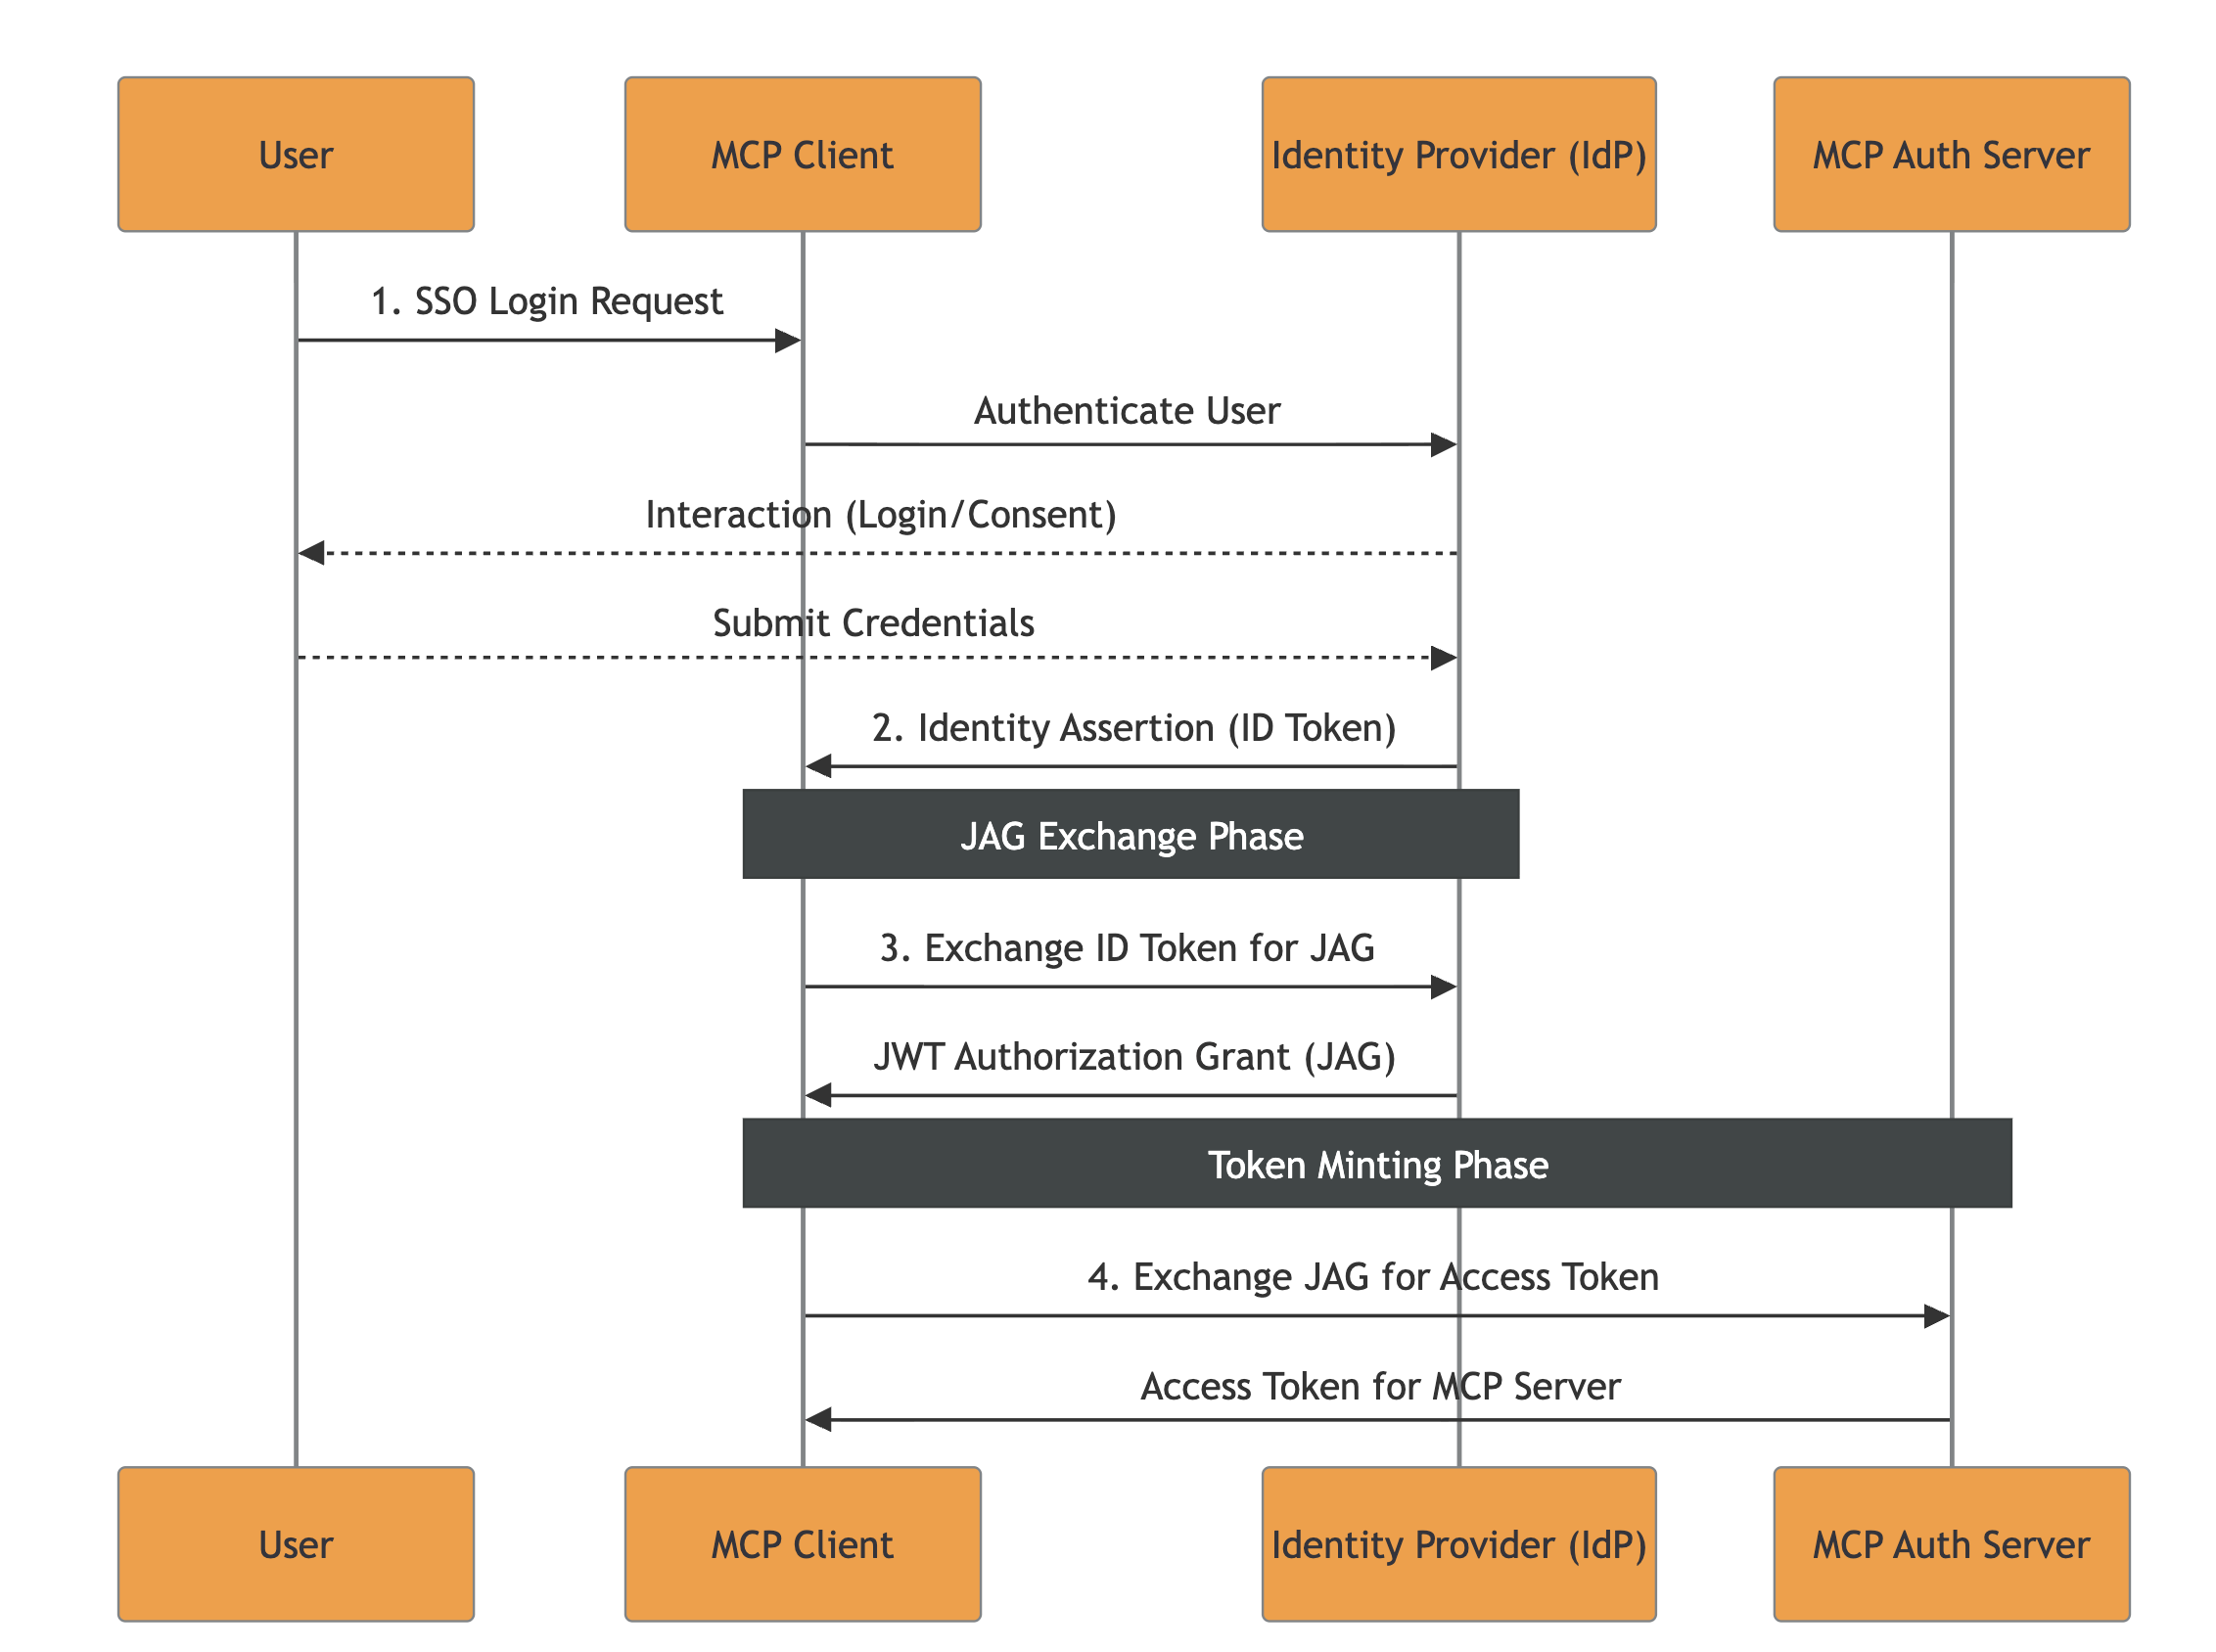
On the other side, there are active discussions around a native Enterprise-Managed Authorization Extension for the Model Context Protocol. During our research on the matter, we had the possibility to do a deep dive into a current draft of the extension, which relies on the Identity Assertion JWT Authorization Grant (JAG). Given our exposure to real-life security engineering challenges faced by our clients, we decided to take a step further and offer our feedback on the draft. We strongly suggest reading the Extension Draft and Doyensec’s pull-request with the updated Security Considerations.
The following summarizes the JAG approach and our considerations. For readers interested in understanding all the aspects in great depth, we would recommend reading the full draft before continuing.
The main idea of this specification revolves around leveraging existing Enterprise Identity Providers (IdPs), such as Okta or Azure AD.
The flow’s key-points are:
The current specification introduces a few outstanding challenges:
1. Access Invalidation Problem
There are three level of tokens issued throughout a correct execution of the flow:
The proposed specification does not explicitly describe mechanisms for invalidating access to an MCP client or revoking issued tokens / ID-JAG.
MCP-Specific Note: While the access invalidation is also unspecified in the parent RFCs, the high risk associated with non-deterministic agentic accesses to tools and resources should require an access invalidation flow for the Enterprise context. Otherwise, the enterprise processes being authorized with the above mentioned spec would not have a clear emergency recovery pattern whenever agents start misbehaving (e.g., injections and other widely known attacks). Consequently, every actor could end-up proposing its own recovery pattern, bringing ambiguity and implementation differences.
2. LLM Scope Abuse Without User Consent
In JAG, the IdP issues an ID Token with no scopes embedded. It just states the identity of the user to allow impersonation from the MCP client. When the MCP client requests a JAG for high-risk scopes like github:write slack:write, no consent pop-up is triggered. The enterprise policy decides on behalf of the user being impersonated.
MCP-Specific Note: While this is totally normal in a classic Machine-to-Machine (M2M) environemnt where the enterprise users are expected to be directly mandating specific tasks on their behalf to automation software, that standard does not apply to the MCP field.
The tasks and actions list being transformed into MCP interactions are not directly chosen deterministically from the end-user.
In general, the consent requirement bypass offered by JAG would allow LLMs to autonomously request any scope permitted by enterprise policies, even if it’s irrelevant to the user’s current task, removing the human-in-the-loop for high-risk actions.
3. How the IdP Creates, Distributes and Validates Clients
Within the JAG proposal, it is not declared how the IdP should issue/distribute client credentials (secret vs. private-key JWT vs. mTLS, how they’re delivered, rotation, etc.).
Moreover, it is not declared how important it is for the IdP to ensure that the audience (The Issuer URL of the MCP server’s authorization server) is linked to the resource (The RFC9728 Resource Identifier of the MCP server).
MCP-Specific Note: While such a practice is unspecified in the parent specifications, enterprise architectures are usually based on multiple IdPs managing access to a wide range of resources, often overlapping: e.g., both IdP A and IdP B can authorize access to app C. Within the presented Enterprise MCP scenario, multiple IdPs could be authorizing multiple MCP Authorization Servers (often overlapping), while each of them manages scopes for a range of MCP Servers.
In such context, clearly defining namespaces and required checks on IdPs and MCP Authorization Servers would help preventing implementation issues like:
- Scope Namespace Collision: If Server A and Server B both use common scope names like
files:read,admin:write, etc., the attacker could leverage a low-privilege ID-JAG from Server B to gain access to Server A ifaudis not checked to be the Authorization Server and theresourceas one of the MCP Servers managed by the specific MCP Authorization Server- Resource Identifier Injection: If the MCP Server Authorization Server doesn’t validate that the
resourceclaim in the ID-JAG matches its own registered resource identifier, it cannot distinguish between ID-JAGs intended for different servers. Once obtained an MCP session, the injected value could be lost and irrelevant, allowing cross-access.The IdP must ensure that JAGs for resources not managed by the caller client are not forged.
4. ID-JAG Replay Concern
Whenever a single ID-JAG can mint multiple MCP Server access tokens, and those access tokens can invoke high-impact tools, then the ID-JAG becomes an amplifier of damage. That is why the decision of enforcing single-use checks on the jti should belong within the specification.
Authentication and authorization, especially in the context of SSO and transitive trust across third parties, have historically been a breeding ground for subtle, high-impact vulnerabilities. MCP does not change this reality. If anything, by introducing additional layers of indirection, remote server pooling, and agent-driven workflows, it amplifies the existing complexity. In the near term, we should expect AuthN/Z in MCP deployments to remain a challenging and error-prone domain.
For this reason, both auditors and developers should apply the strictest possible validation at every step of any SSO flow involving MCP. Token issuance, audience binding, scope enforcement, session propagation, identity mapping, trust establishment, and revocation logic all deserve explicit scrutiny. The end-to-end sequence diagram presented in this article is intended as a practical starting point: a tool to reason about the full authorization chain, enumerate trust boundaries, and systematically derive a security test plan. Every transition in that flow should be treated as a potential injection point or trust confusion opportunity.
When it comes to enterprise-managed authorization models, approaches such as JAG raise significant concerns. They introduce complex cross-specification dependencies, expand the number of actors involved in trust decisions, and substantially widen the attack surface. More critically, the model’s reliance on full user impersonation by non-deterministic agents, capable of autonomously selecting and executing tasks without explicit per-action user consent, is misaligned with MCP’s security requirements. Delegation without tight contextual constraints is indistinguishable from privilege escalation when boundaries are not rigorously enforced.
Based on our experience, a more robust direction for enterprise MCP deployments would emphasize strong, explicit trust anchors and protocol minimization. Technologies such as certificate-based authorization and mTLS, adapted specifically to MCP’s interaction model, provide clearer security properties and reduce ambiguity in identity binding. These mechanisms should be complemented by:
In short, the goal should not be to replicate the full complexity of traditional enterprise SSO stacks inside MCP, but to reduce implicit trust, constrain delegation semantics, and make authorization decisions auditable and deterministic.
If the industry has learned anything from the past decade of OAuth, OIDC, SAML, and SCIM vulnerabilities, it is that complexity without strong invariants inevitably leads to security gaps. MCP deployments would do well to internalize that lesson early.
In cooperation with the Polytechnic University of Valencia and Doyensec, I spent over six months during my internship in a research that combines theoretical foundations in code signing and secure update designs with a practical implementation of these learnings.
This motivated the development of SafeUpdater, a macOS updater vaguely based on the update mechanisms used by Signal Desktop, but otherwise designed as a modular extension.
SafeUpdater is a package designed for MacOS systems, but its interfaces are easily extensible to both Windows and Linux.
Please note that “SafeUpdater” is not intended to be used as a general-purpose package, but as a reference design illustrating how update mechanisms can be built around explicit threat models and concrete attack mitigations.
⚠️ This software is provided as-is, is not intended for production use, and has not undergone extensive testing.
A software update is the process by which improvements, bug fixes, or changes in functionality are incorporated into an existing application. This process is crucial for maintaining the security of the app, improving performance, and ensuring compatibility with different systems. Because updates are central to both the maintenance and evolution of software, the update mechanism itself becomes one of the most sensitive points from a security perspective.
In Electron applications, an updater typically runs with full user privileges, downloading executable code from the Internet, and may install it with little or no user interaction. If this mechanism is compromised, the result is effectively a remote code execution channel.
Being one of the most widely used application frameworks for desktop apps, Electron also represents one of the most attractive targets for attackers. While the official framework update mechanism provides a ready-to-use solution for most applications, it doesn’t protect against certain classes of attacks.
Currently, there are two main solutions for implementing an auto-update system in ElectronJS:
The first is the built-in auto-updater module provided by Electron itself. This module handles the basic workflow of checking if there are updates available, downloading the update, and applying it, using standard HTTP(S) and relying on code signing and framework-specific metadata for file integrity.
One of the simplest ways to use it is with update-electron-app, a Node.js drop-in solution that is based on Electron’s standard autoUpdater method without changing its underlying security assumptions. The following code snippet shows an example of its implementation:
const { updateElectronApp, UpdateSourceType } = require('update-electron-app')
updateElectronApp({
  updateSource: {
    type: UpdateSourceType.StaticStorage,
    baseUrl: `https://my-bucket.s3.amazonaws.com/my-app-updates/${process.platform}/${process.arch}`
  }
})
This module builds on top of Electron’s autoUpdater, providing a higher-level interface:
  autoUpdater.setFeedURL({
    url: feedURL,
    headers: requestHeaders,
    serverType,
  });
The second solution is using Electron-Builder’s electron-updater library, which offers a more integrated approach for managing application updates. When the application is built, a release file named latest.yml is generated, containing metadata about the latest version. These files are then uploaded to the configured distribution target.
The developer is responsible for integrating the updater into the application lifecycle and configuring the update workflow.
| Feature | Electron Official (autoUpdater) |
Electron-Builder (electron-updater) |
|---|---|---|
| Publication server requirement | Requires self-hosted update endpoints | Uses built-in providers (e.g. GitHub Releases) |
| Code signature validation | macOS only | macOS and Windows (custom and OS validation) |
| Metadata and artifact management | Manual upload of metadata and artifacts required | Automatically generates and uploads release metadata and artifacts |
| Staged rollouts | Not natively supported | Natively supported |
| Supported providers | Custom HTTP(S) only | Multiple providers (GitHub Releases, Amazon S3, and generic HTTP servers) |
| Configuration complexity | Higher, especially with a custom server | Minimal configuration |
| Cross-platform compatibility | Platform-specific tools (Squirrel.Mac, Squirrel.Windows) | Unified cross-platform support (Windows, macOS, Linux) |
Now that we have a clear picture of the software update mechanisms available in ElectronJS today, we can shift our focus to two specific threats that are not mitigated by any of the existing open-source solutions. It is worth noting that most of the considerations discussed here are not specific to ElectronJS itself, but apply more broadly to software updaters for desktop applications in general.
At the core of these issues lies a fundamental limitation of modern operating systems: the lack of a reliable, built-in mechanism to fully validate the integrity of the software currently running on the system. While macOS, thanks to its relatively closed ecosystem, does provide native capabilities such as code signing and notarization to help verify software integrity at runtime, this is not the case on Windows. As a result, Windows applications cannot rely on the operating system alone to assert that the updater or the application binary has not been tampered with.
Because of this gap, software updaters must implement additional safeguards and workarounds to compensate for the missing integrity guarantees. These compensating controls are often complex, error-prone, and inconsistently applied across projects, which ultimately leaves room for entire classes of attacks that remain unaddressed even in the most popular desktop applications.
In all software updater implementations, the following assets are considered critical and must be protected:
In this post, we focus only on the threats that are not mitigated by the default ElectronJS software update mechanisms. In fact, given the absence or limited capabilities around software integrity checks at the OS level, the following threats remain unaddressed:
| Threat | Attack Vector | Threat Actor | Potential Impact |
|---|---|---|---|
| Downgrade (Rollback) Attack | Manipulation of update manifest or version metadata to serve older releases | Malicious third party, MITM (Man-in-The-Middle), compromised server | Reintroduction of known vulnerabilities |
| Integrity Attack | Tampering with update binaries, installers, or metadata | MITM (Man-in-The-Middle), compromised CDN, update server, or build pipeline | Arbitrary code execution |
| Race Condition Attack | Replacing verified update files between verification and installation | Local attacker with system access | Execution of malicious code, privilege escalation |
| Untested Version Attack | Serving signed but non-production (alpha/beta/dev) builds via update channel | Malicious third party, MITM (Man-in-The-Middle), insider threat | Exposure to unreviewed features, debug functionality, or new vulnerabilities |
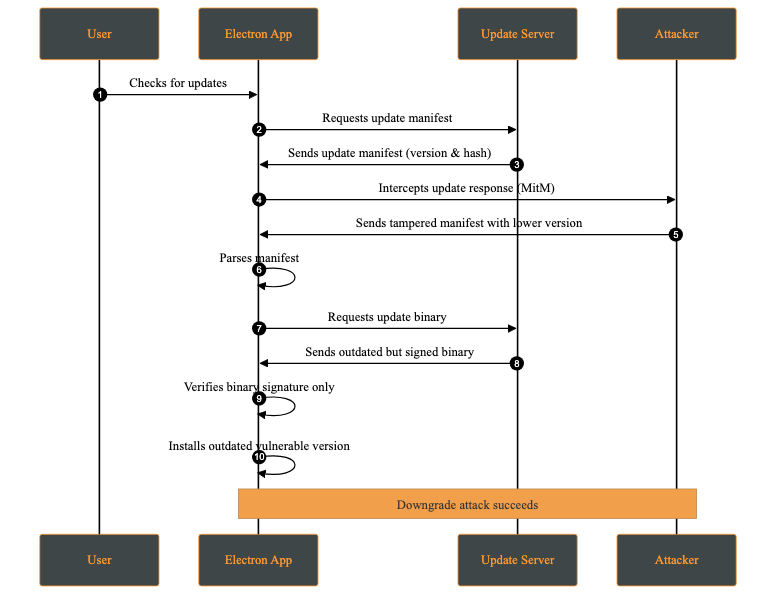
A downgrade attack occurs when an attacker forces the application to install an older, vulnerable version instead of the latest secure release. This may happen by compromising the update server, or intercepting via a MITM (Man-in-The-Middle) attack and modifying the update manifest to offer a lower version.
The attacker’s objective is to reintroduce previously fixed vulnerabilities by deploying an outdated version of the application. Once installed, the attacker can exploit these known weaknesses.
Attack Steps:
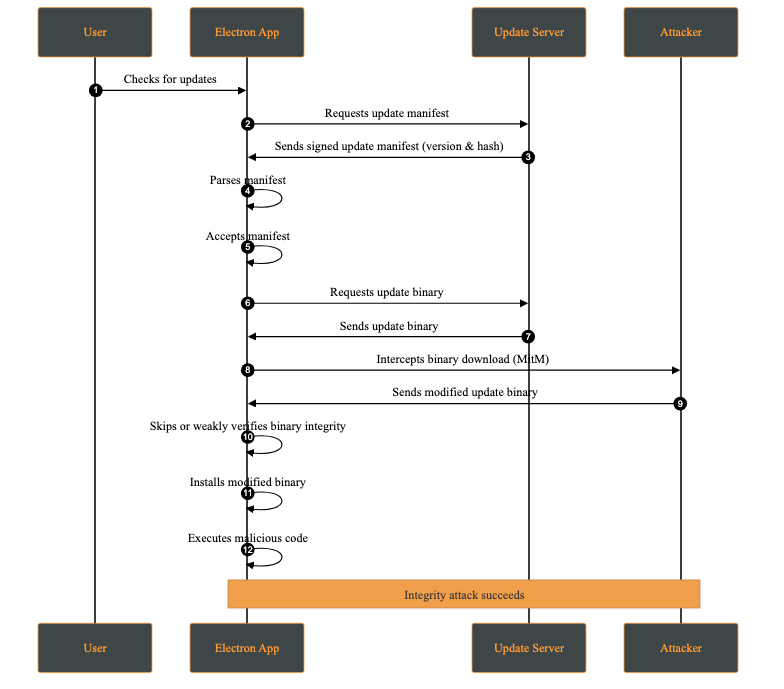
An integrity attack involves the unauthorized modification of update artifacts, such as binaries, installation packages, or metadata, either at rest or during transmission. The attacker’s goal is to have the system execute altered code while believing it originates from a trusted source.
Attack Steps:
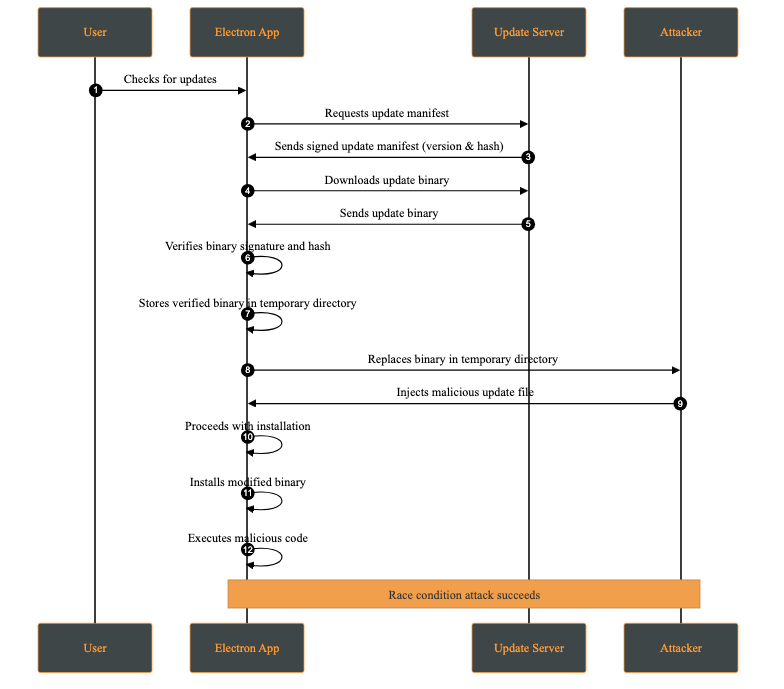
A race condition attack occurs when multiple processes access and modify shared resources concurrently, and the final outcome depends on the timing of those operations. In the context of software updates, this may allow an attacker with local access to replace or modify update files between verification and installation.
This attack requires the attacker to have access to the victim’s machine. While this may appear unlikely, multi-user systems or shared environments make this a realistic threat.
A practical case occurs when the attacker has access to the temporary directory where the update files are stored. This attack is possible whenever signature verification and update application are not performed atomically on the same file descriptor.
Attack Steps:
An untested version attack occurs when an attacker causes the client to install a development, pre-production, or experimental version of the application (e.g., alpha or beta) instead of a stable production release. This typically occurs when development and production releases are not cryptographically separated, for example when the same signing keys or update channels are shared across environments.
Although such versions may be signed, they often contain unreviewed features, experimental dependencies, or debug functionality that introduces new vulnerabilities.
Attack Steps:
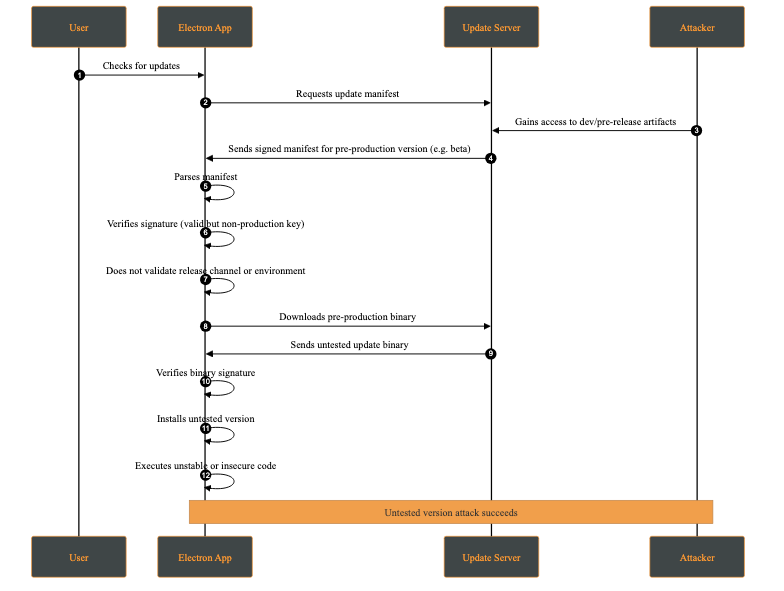
This behavior makes the client fail to distinguish between production and non-production releases at a cryptographic or policy level.
Our SafeUpdater is built around a set of core security mechanisms designed to protect the update process against the impact of attacks such as downgrade attacks, integrity violations, man-in-the-middle interference, and local race conditions. Each mechanism addresses a specific set of threats identified in the threat model.
The updater is designed to integrate with Electron Builder for application builds; however, this integration is optional, as the manifest can be generated independently.
All update components are cryptographically signed using Ed25519, a modern elliptic-curve signature known for its strong security guarantees. By verifying signatures using a public key embedded in the application, SafeUpdater ensures that update manifests and binaries are from a trusted source and haven’t been tampered with. Any modification to a signed file makes the signature check fail, causing the update to be rejected.
The deterministic message signing is composed of:
SHA-256(file) + version
This prevents unauthorized downgrade attacks by cryptographically binding the update to a specific version identifier.
Once the update asset is received, a signing message is generated. This message will later be used to verify the corresponding signature file:
async function generateMessage(updatePackagePath, version) {
  const hash = await _getFileHash(updatePackagePath);
  const messageString = `${Buffer.from(hash).toString('hex')}-${version}`;

  return Buffer.from(messageString);
}
After generating the message, it is compared against the signature provided alongside the update file. The verification uses the public key associated with the application’s signing infrastructure. If the signature does not match, the update is rejected, preventing malicious modifications from being applied:
export async function verify(publicKeyBuffer, messageBuffer, signatureBuffer) {
  return ed.verify(signatureBuffer, messageBuffer, publicKeyBuffer);
}
In addition to signature verification, SafeUpdater checks the SHA-512 hash on the downloaded update binaries. The expected hash is stored in the signed update manifest and compared against the hash of the downloaded file. This layered approach ensures end-to-end integrity, protects against accidental corruption as well as intentional binary tampering during transmission or storage.
// Verify file integrity
const computedHash = createHash('sha512').update(fileContents).digest('base64');
if (computedHash !== expectedSHA512) {
  throw new Error('Integrity check failed');
}
Update metadata is distributed through an immutable version manifest that describes available releases, including version numbers, file locations, and cryptographic hashes. Since these manifests are signed, this prevents manifest tampering if the attacker is trying to reintroduce vulnerable versions or pointing them to a malicious location.
To mitigate local attacks such as race conditions (TOCTOU vulnerabilities), SafeUpdater stores temporary update files in restricted directories with owner-only permissions. Verification and installation operate on the same file path, which limits opportunities for tampering. However, these steps are not fully atomic (for example, they do not verify and install using the same file descriptor), so complete elimination of time-of-check to time-of-use risks is not guaranteed.
SafeUpdater ensures secure and reliable updates for Electron applications. This update lifecycle follows a structured process from version check to installation:
${sha256Hex}-${version}SafeUpdater is highly configurable through environment-based JSON files using the config package.
The primary configuration file config/default.json includes the following settings:
The Ed25519 public key used to verify update signatures. This key must be hex-encoded (64 hex characters).
{
  "updatesPublicKey": "<..>"
}
Note: You can generate the key using the
generateKeys.jsscript from thetoolsfolder:
node tools/generateKeys.js  # Outputs public.key
cat public.key
The base URL for your update server. SafeUpdater constructs paths for manifests and binaries automatically:
{
  "updatesUrl": "https://updates.yourcompany.com"
}
Path construction examples:
Releases manifest: ${updatesUrl}/releases/versions.json
Version metadata: ${updatesUrl}/releases/${version}/${version}.yml
Update binaries: ${updatesUrl}/releases/${version}/${filename}
A master switch for the update system:
{
  "updatesEnabled": true
}
Provide a PEM-encoded X.509 certificate for TLS validation. This is useful for self-signed certificates during development or as part of a certificate pinning strategy in production.
{
  "certificateAuthority": "-----BEGIN CERTIFICATE-----\nMIIDXTCCAkWgAwIBAgIJAKL...\n-----END CERTIFICATE-----"
}
Disables TLS certificate validation.
{
  "allowInsecureTLS": true
}
Warning: Never use this in production! Only for development environments with self-signed certificates.
false)Enables the ability to roll back to a previous version of the app.
{
  "downgradeEnabled": true
}
Allows cryptographically verified downgrades and enforces a minimum version to prevent unsafe rollbacks.
For debugging purposes only, we have developed a set of tools under the /tools folder, which provides all tools required to generate the Ed25519 key pairs, sign release artifacts, and produce signed manifests.
This repository allows developers to:
By following the two-step process below, SafeUpdater ensures that end users only receive verified, unmodified updates, protecting against downgrade attacks, tampering, or malicious binaries.
Sign release artifacts after building your application using electron-builder. It is crucial to sign every artifact that will be downloaded or trusted by the updater.
# Sign ZIP file
node tools/sign.js /path/to/my-app-2.0.0-mac.zip "2.0.0"

# Sign DMG file
node tools/sign.js /path/to/my-app-2.0.0.dmg "2.0.0"

# Sign YAML metadata
node tools/sign.js /path/to/2.0.0.yml "2.0.0"
For local testing, you can serve updates over HTTPS using a self-signed certificate.
server.py:
from http.server import HTTPServer, SimpleHTTPRequestHandler
import ssl

port = 443

httpd = HTTPServer(('0.0.0.0', port), SimpleHTTPRequestHandler)
httpd.socket = ssl.wrap_socket(
    httpd.socket,
    keyfile='key.pem',
    certfile='server.pem',
    server_side=True
)

print(f"Server running on https://0.0.0.0:{port}")
httpd.serve_forever()
This server is intended strictly for development and testing purposes. In production, deploy behind a properly secured, scalable, and monitored infrastructure.
Even when using modern and widely adopted frameworks, software update mechanisms must compensate for several shortcomings introduced by the underlying operating systems themselves. These limitations place a non-trivial burden on application developers, who are often forced to re-implement critical security guarantees that should ideally be enforced at the platform level.
This project set out to analyze the current limitations of software update mechanisms in ElectronJS and to propose a safer alternative to the approaches commonly used today. By providing strong cryptographic guarantees and a well-defined, transparent update flow, our reference implementation (SafeUpdater) aims to reduce the attack surface associated with software updates and to make secure design choices the default rather than an afterthought. In doing so, it allows developers to focus on building application features without compromising on update security.
SafeUpdater was developed as part of my university thesis at the Polytechnic University of Valencia and during my internship at Doyensec. While the project would still require extensive performance evaluation, security auditing, and real-world testing before being considered production-ready, we believe it offers a solid foundation and a practical starting point for building more robust and trustworthy software update mechanisms for ElectroJs-based applications.