CSPT the Eval Villain Way!
03 Dec 2024 - Posted by Dennis GoodlettDoyensec’s Maxence Schmitt recently built a playground to go with his CSPT research. In this blog post, we will demonstrate how to find and exploit CSPT bugs with Eval Villain. For this purpose, we will leverage the second challenge of Maxence’s playground.
A step-by-step intro to CSPT with Eval Villain
The next image shows what this methodology yields.
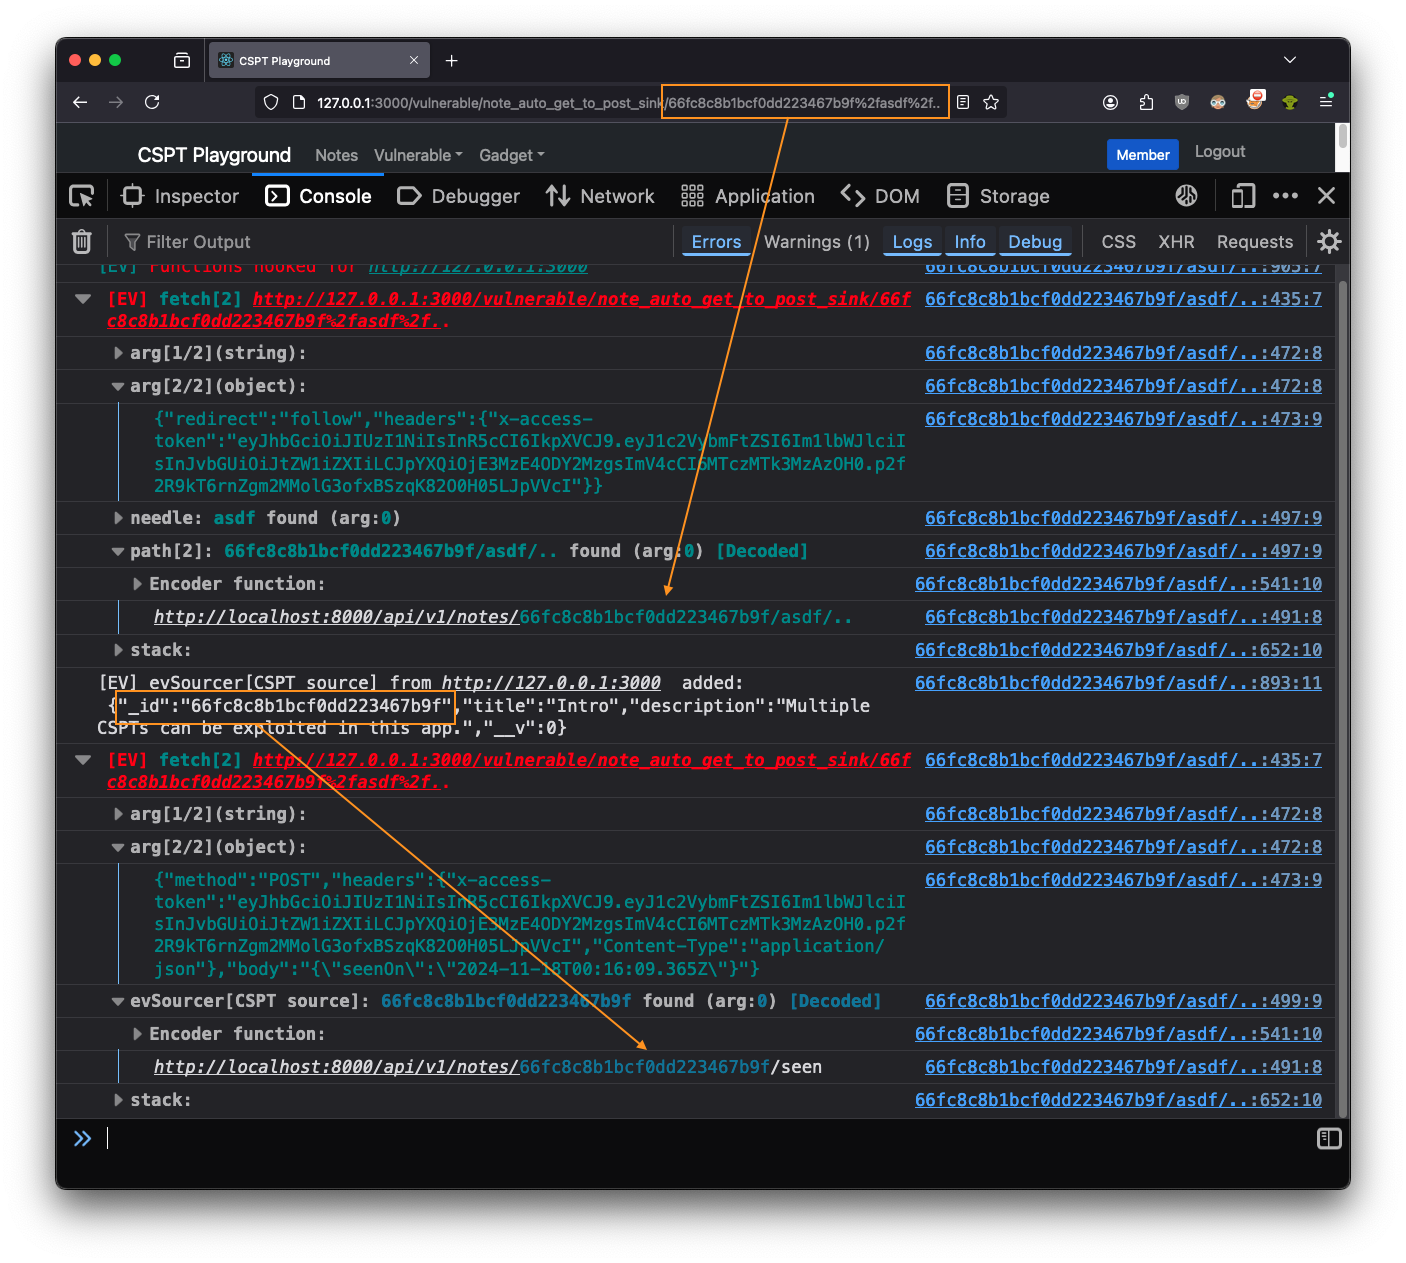
We’ve added some boxes and arrows in orange to better illustrate the current situation. First,
Eval Villain saw that part of the page’s path is being used in a fetch request.
There, you can plainly see the asdf%2f.. was being URL decoded. Or if you prefer, you can expanded
the “Encoder function” group to check. Either way, Eval Villain had discovered the CSPT sink.
The second square is on top of a debug statement from evSourcer. This was
where the response from the first fetch was being added to Eval Villain’s
source bank. As a result, Eval Villain warned us that the _id parameter from
the CSPT response had hit another fetch sink. Again, you could get a bit more
details from the “Encoder function”.
From the arg[2/2] of each fetch we learned more. The first fetch is a GET
that had "redirect":"follow" and the second had "method":"POST". So we
controlled the path of a client-side GET request and an open redirect could have sent
that request to our own server. The response of our own server would have then been
used in the path of an authenticated POST request. This one image shows the
entire exploit chain for a CSPT2CSRF exploit.
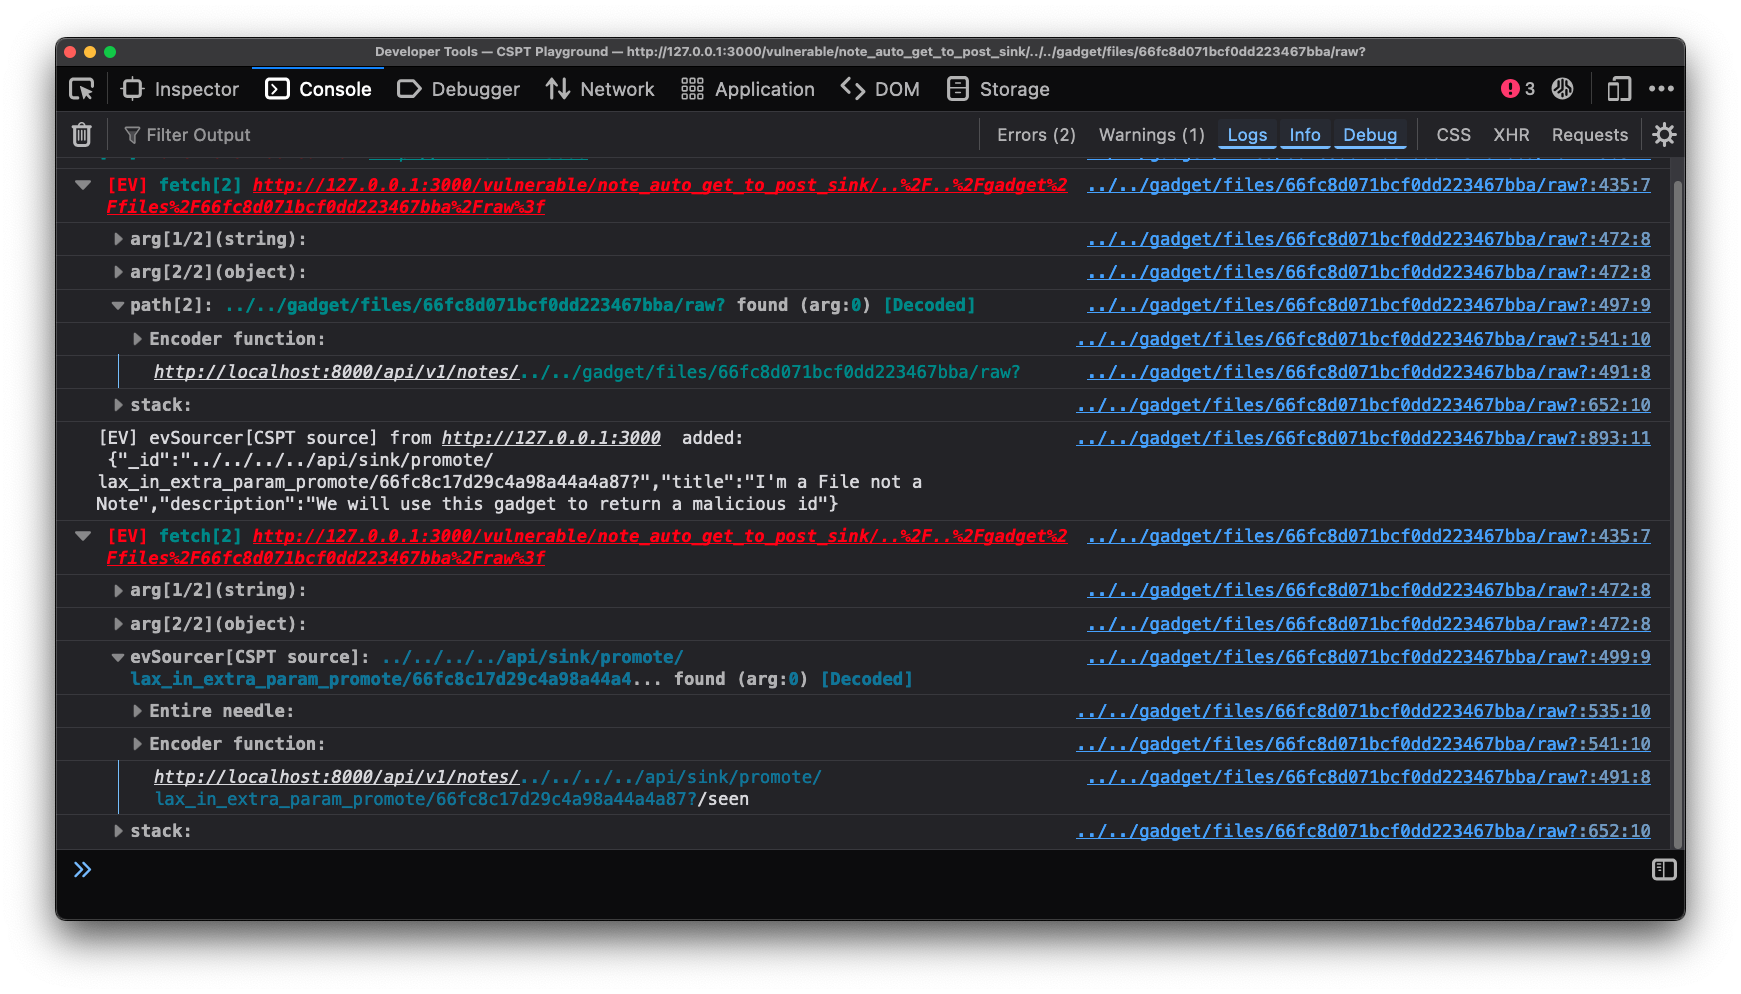
All of this instrumentation stays around to help us with our exploit. Clicking the provided solution we see the following image. This shows exactly how the exploit works.
Building the picture yourself
Step 0: Tools
You will need Firefox with Eval Villain installed.
You’ll also need the CSPT playground,
which runs in Docker via docker compose up. This should bring up a vulnerable
web app on http://127.0.0.1:3000/. Read the README.md for more info.
We really do recommend trying this out in the playground. CSPT is one of those bugs that seems easy when you read about it in a blog but feels daunting when you run into it on a test.
Step 1: Finding a CSPT
Log into the playground and visit the “CSPT2CSRF : GET to POST Sink” page. Open
the console with ctrl+shift+i on Linux or cmd+option+i on Mac. Ensure Eval
Villain is turned on. With the default configuration of Eval Villain, you
should just see [EV] Functions hooked for http://127.0.0.1:3000 in the
console.
In a real test though, we would see that there is obviously a parameter in the URL path. Eval Villain does not use the path as a source by default, due to false positives. So lets turn on “Path search” in the “Enable/Disable” pop-up menu (click the Eval Villain logo).
Now, after a page refresh, Eval Villain will tells us about two calls to fetch,
each using the path. We don’t know if they are CSPT yet, we need to check if
../ is accepted, but it looks hopeful.
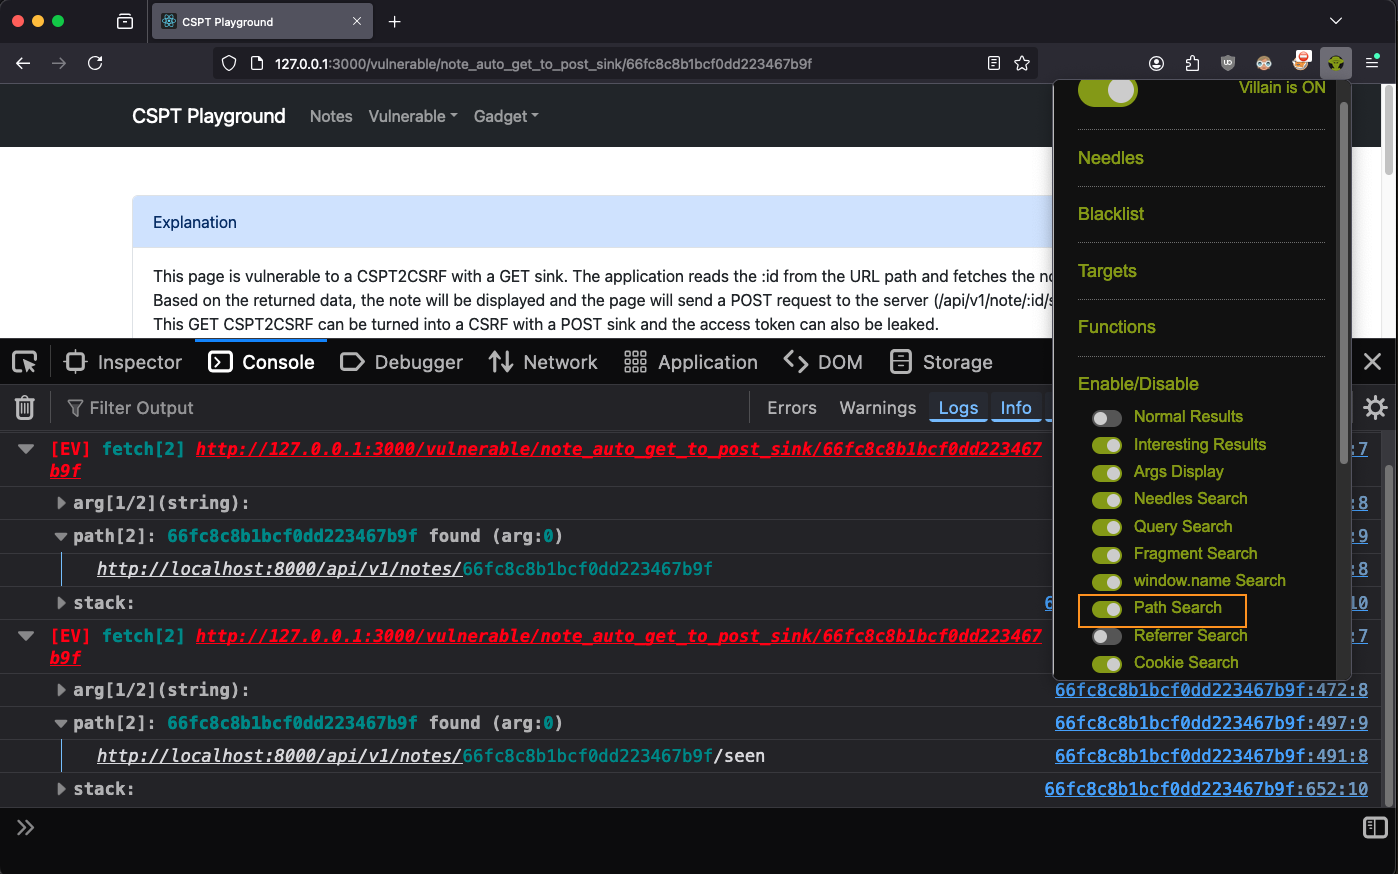
Note: You may only see one fetch here, that is ok.
Step 2 Testing For CSPT
To test for actual CSPT, just add the string %2fasdf%2f.. to the end of the
path. This is a good tip, since this will normalize to the original path, the
website will act the same if it’s vulnerable. When you refresh the page you
will see this in the console.
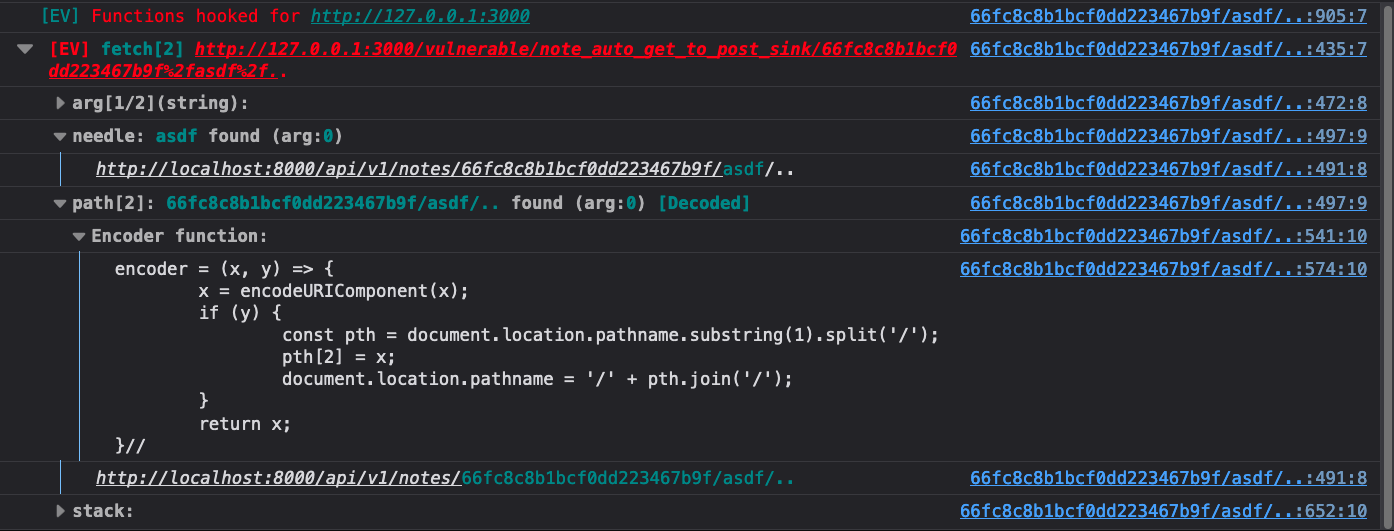
It’s that easy to find a CSPT primitive. Had the source been in window.name or a
URL parameter, Eval Villain would likely have found it right away.
Since the URL path was encoded, Eval Villain gives us an encoder function. You can paste that into your console and use it to try new payloads quickly. The function will automatically apply URL encoding.
With a CSPT primitive, the next step toward exploitation is learning how the response of this request is used. For that, we want to ingest the response as a new source for Eval Villain.
Step 3 Enable evSourcer
First you need to enable the evSourcer global in Eval Villain. Go to the
configuration page from the pop-up menu and scroll to the globals table. Enable
the row that says “evSourcer”. Don’t forget to click save.
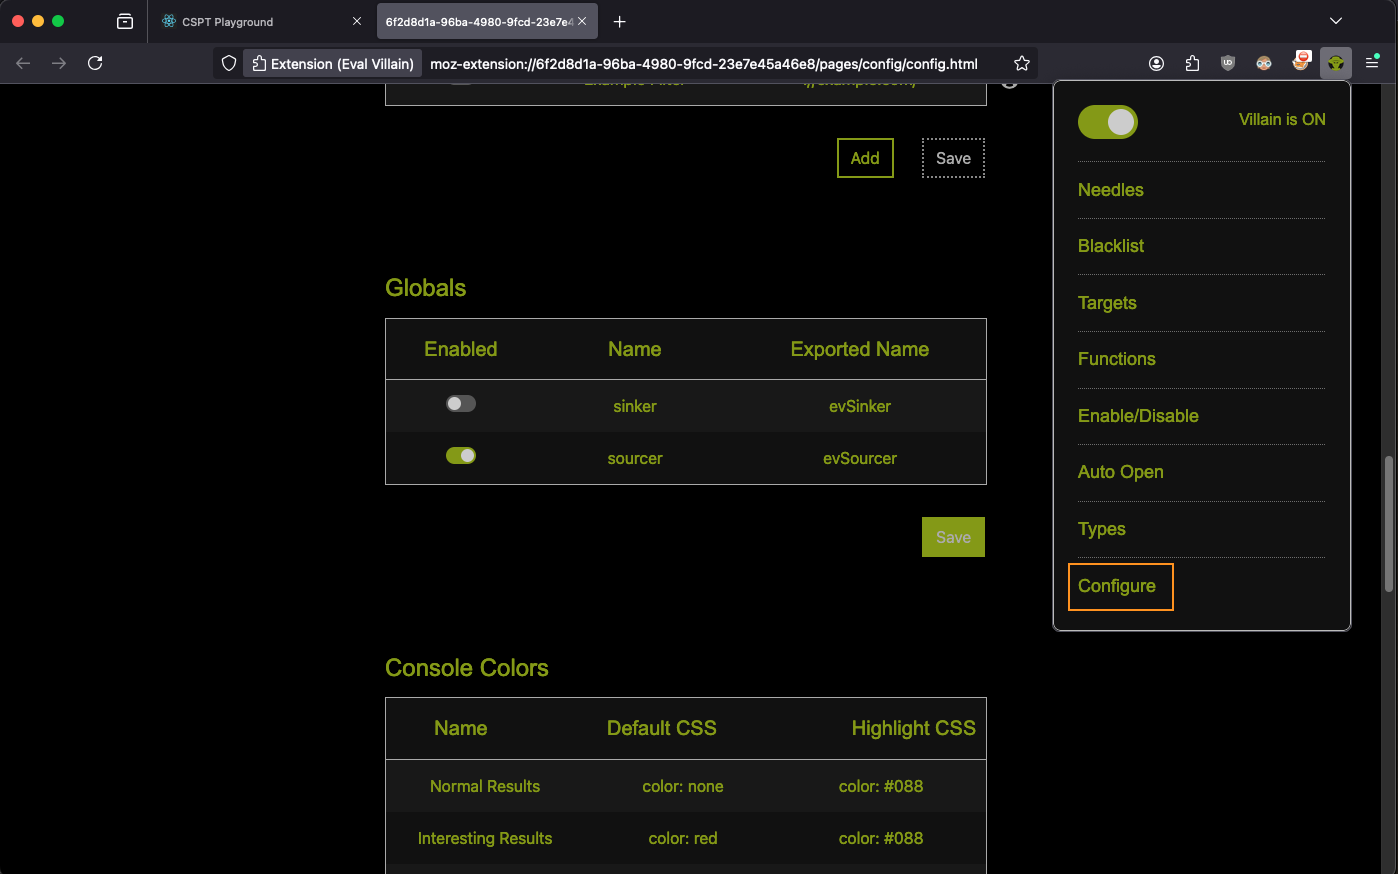
Now you can refresh the page and just run evSourcer.toString() in the console
to verify the configuration change took.

You can run a quick test to try out the feature. Anything that goes into the
second parameter of this function will be put into the Eval Villain source
bank. Before using evSinker the string foobar does not generate a warning
from the eval sink, afterward it does.

Step 4: Getting the response of the CSPT request into evSourcer
So, if we put the response of the CSPT request into evSourcer, Eval Villain
can tell us if it hits eval, .innerHTML, fetch or any other sink we have
hooked.
To find the response to the CSPT request, we just look at the stack trace Eval Villain gave us.
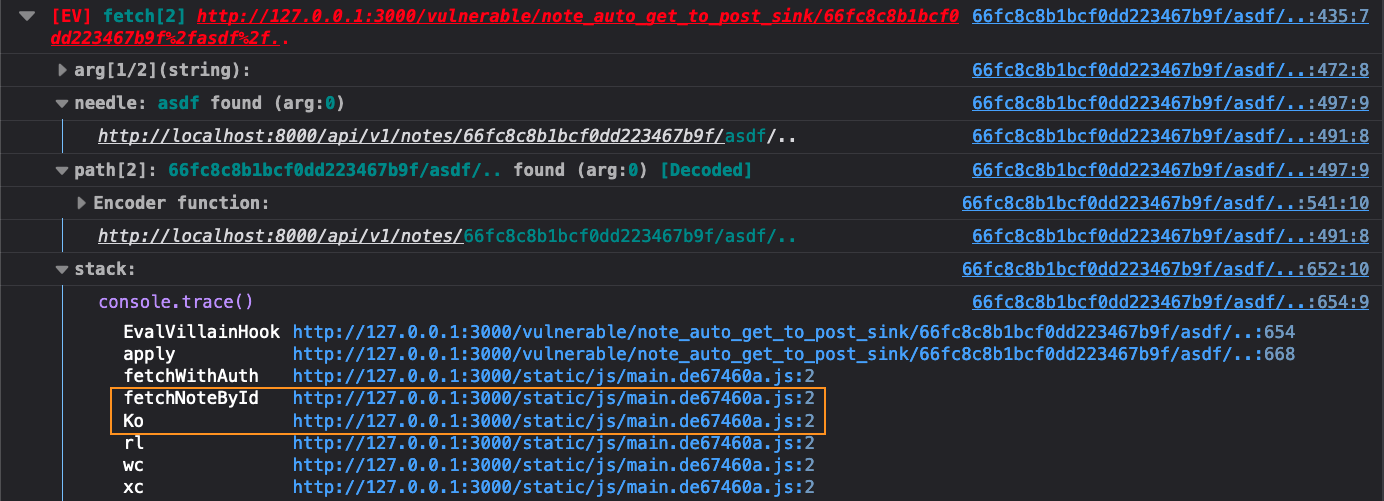
Here we have highlighted what we think of as the “magic zone”. When you see
function names go from minified garbage, to big readable strings, that is where
you typically want to start. That often means a transition from library code to
developer written code, either forward or back. One of those two functions are
probably what we want. Based on context, fetchNoteById is probably returning the
info to Ko. So go to the Ko function in the debugger by clicking the link
next to it. Once you get there, beautify the code by clicking the {} icon in
the lower left of the code pane.
You will see some code like this:
      return (0, t.useEffect) (
        (
          () => {
            r &&
            ot.fetchNoteById(r).then((e => { // <-- fetchNoteById call here
              ot.seenNote(e._id),         // <-- so `e` is probably our JSON response
              n(e)
            })).catch((e => {
              //...
fetchNoteById apparently returns a promise. This makes sense,
so we would normally set a breakpoint in order to inspect e and compare it with
the response from fetch. Once you validate it, it’s time to instrument.
Right-click on the line number that contains ot.seenNote and click “Add
Conditional breakpoint”. Add in the evSinker call, using a name you can
recognize as injecting the e variable. The evSinker function always returns
false so we will never actually hit this breakpoint.
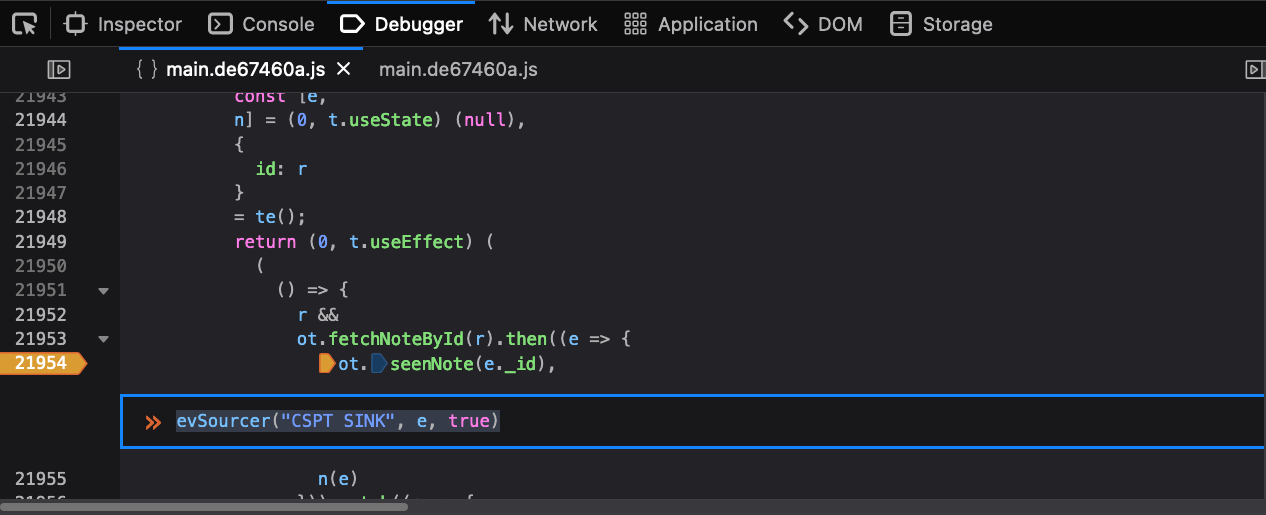
Notice we have disabled source maps. Source maps can optimize out variables and make debugging harder. Also, Firefox sometimes takes a minute to work through beautifying code and putting breakpoints at the right spot, so just be patient.
Step 5: Refresh the page, check the secondary sink
Now we just refresh the page. Since we used true as the last parameter to
evSinker, we will use console debugging to tell us what got injected. Enable
“Debug” in the console. We can also enable XHR in the console to see requests
and responses there. The requests we are interested in will directly follow
Eval Villain output to the console, so they are easy to find. This is what we see.
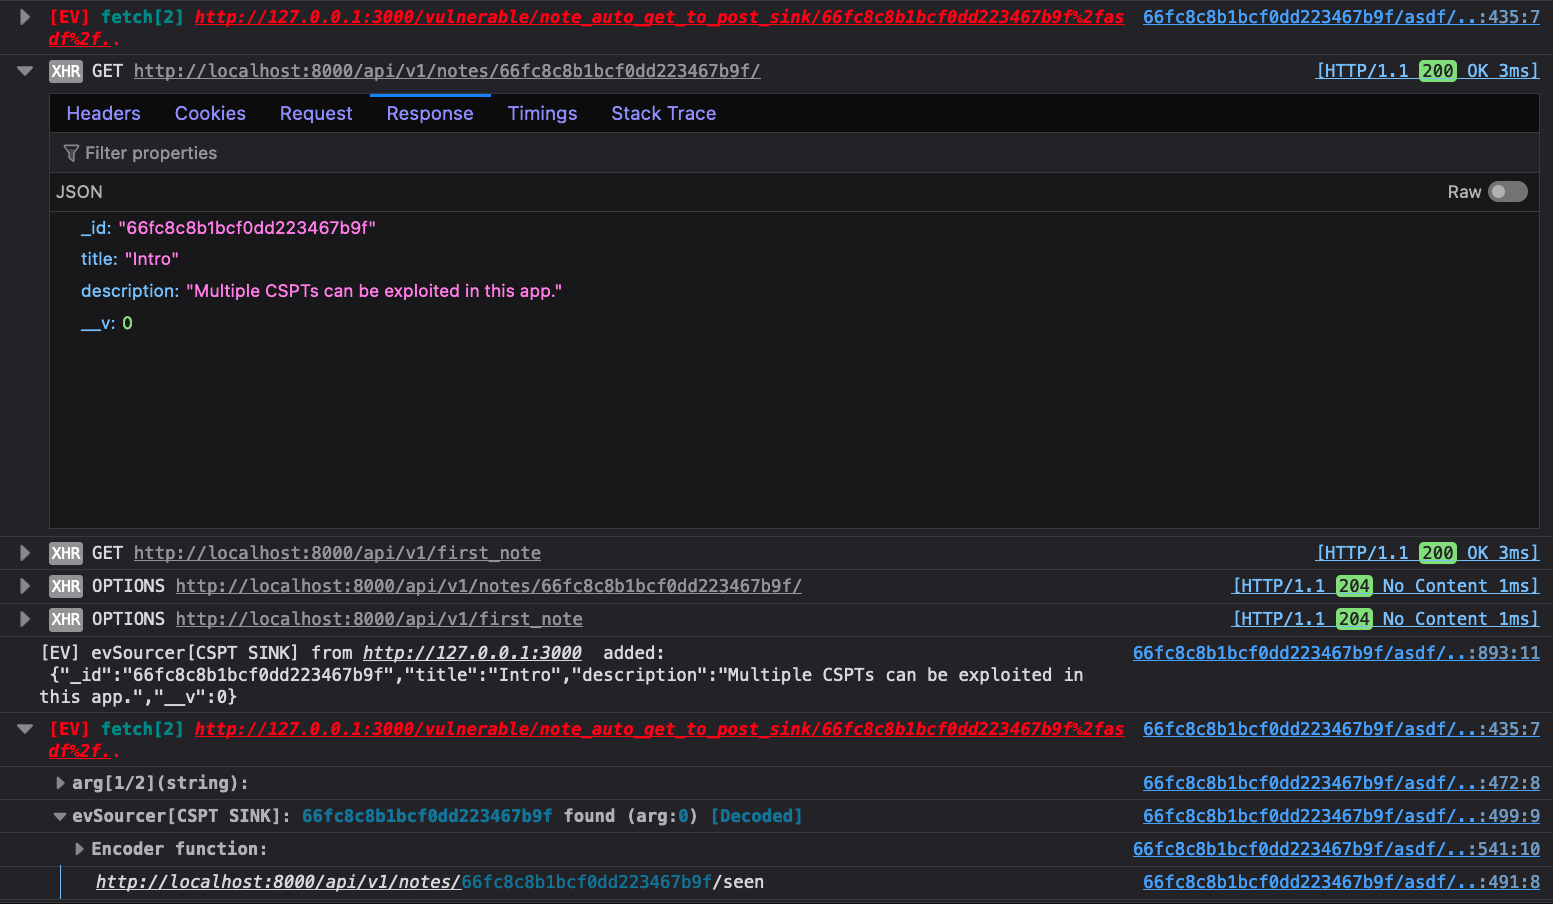
For the sake of room, we closed the first fetch group. It does show the
asdf%2f.. payload hitting fetch. The “XHR” entry we have open there does not
show the directory traversal because it was normalized out. Eval Villain makes
it easy to find though. The response from the “XHR” can be seen injected in the
console debug below it. Then of course Eval Villain is able to spot it hitting
the fetch sink.
Step 6: Extra little things
You may notice that there is no arg[2/2] output in the last picture. That
argument is a JavaScript object. Eval Villain by default is configured to only
look at strings. Open the pop-up menu, click types and enable objects. Then when
you refresh the page you can see from the Eval Villain output what options are
being passed to fetch.
Step 7: Exploit
The playground makes finding gadgets easy. Just go to the “gadgets” drop down in the page. The real world does not have that, so Burp Suite’s Bambda search seems to be the best bet. See Maxence’s CSPT research for more on that.
BONUS Feature! Eval Villain in Chrome, Electron and maybe Web Views?
Eval Villain is really just a JavaScript function, with config, that Firefox copy/pastes into each page before it loads. Once injected, it just uses the console to log output. So in theory, you could copy paste this same code manually into anywhere JavaScript is accepted.
Eval Villain 1.11 lets you do just that. Go to the configuration page and scroll to the very bottom. You will see a “Copy Injection” button. If you click it, the entire Eval Villain injection, along with the current configuration, will be put into your clipboard.
Using this we have gotten Eval Villain into an instrumented Electron App. The following screen shot shows Eval Villain running from a conditional breakpoint in Burp’s built-in Chrome browser.
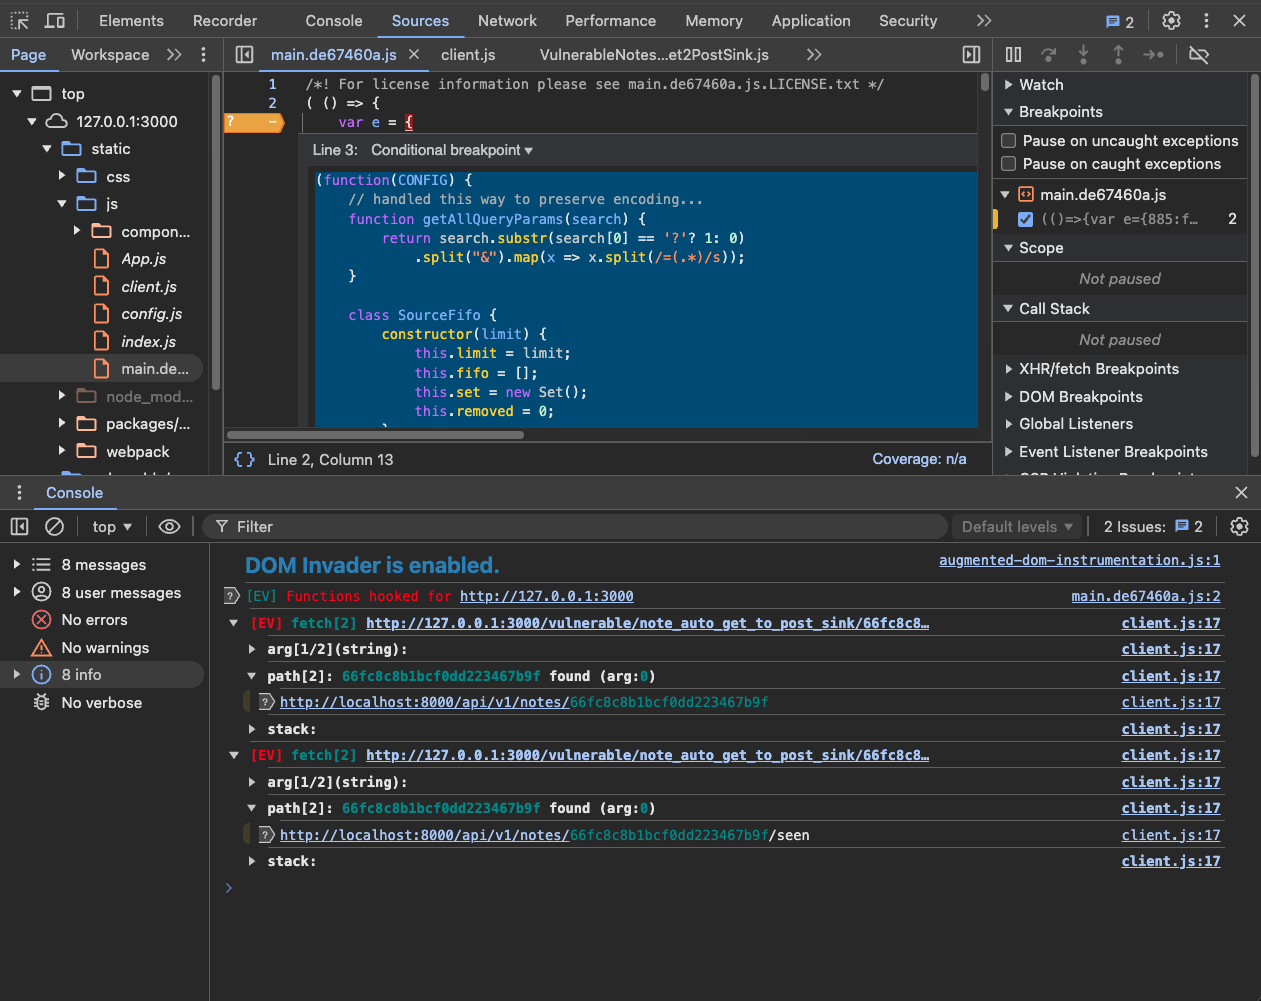
Or you can use the HTTP Mock extension in Burp to paste Eval Villain into a web response. We have not tried it yet, but it will be cool to inject it into a Web View on Android using Frida.
Conclusion
Instrumenting the target code does not really take that long. This blog post explained step by step on how to leverage Eval Villain in order to find and exploit CSPT vulnerabilities. Even for learning new tricks using a playground, Eval Villain helps us debug little mistakes.
Make sure to use the right tool for the right job. For example, Eval Villain can’t decode everything (check out the fragment challenge). Maxence developed a great Burp Extension for CSPT, but it lacks insight into the DOM. Some other tools are Geko, DOMLogger++ and DOM Invader (enable xhr.open and fetch in sinks). Mix and match what works best for you.

