ABOUT US
We are security engineers who break bits and tell stories.
Visit us
doyensec.com
Follow us
@doyensec
Engage us
info@doyensec.com
Blog Archive
© 2026 Doyensec LLC 
After the public launch of InQL we received an overwhelming response from the community. We’re excited to announce a new major release available on Github. In this version (codenamed dyno-mites), we have introduced a few cool features and a new logo!

As you might know, InQL can be used as a stand-alone tool, or as a Burp Suite extension (available for both Professional and Community editions). Using GraphQL built-in introspection query, the tool collects queries, mutations, subscriptions, fields, arguments, etc to automatically generate query templates that can be used for QA / security testing.
In this release, we introduced the ability to have a Jython standalone GUI similar to the Burp’s one:
$ brew install jython
$ jython -m pip install inql
$ jython -m inql
Many users have asked for syntax highlighting and code completion. Et Voila!

InQL v2 includes an embedded GraphiQL server. This server works as a proxy and handles all the requests, enhancing them with authorization headers. GraphiQL server improves the overall InQL experience by providing an advanced query editor with autocompletion and other useful features. We also introduced stubbing of introspection queries when introspection is not available.
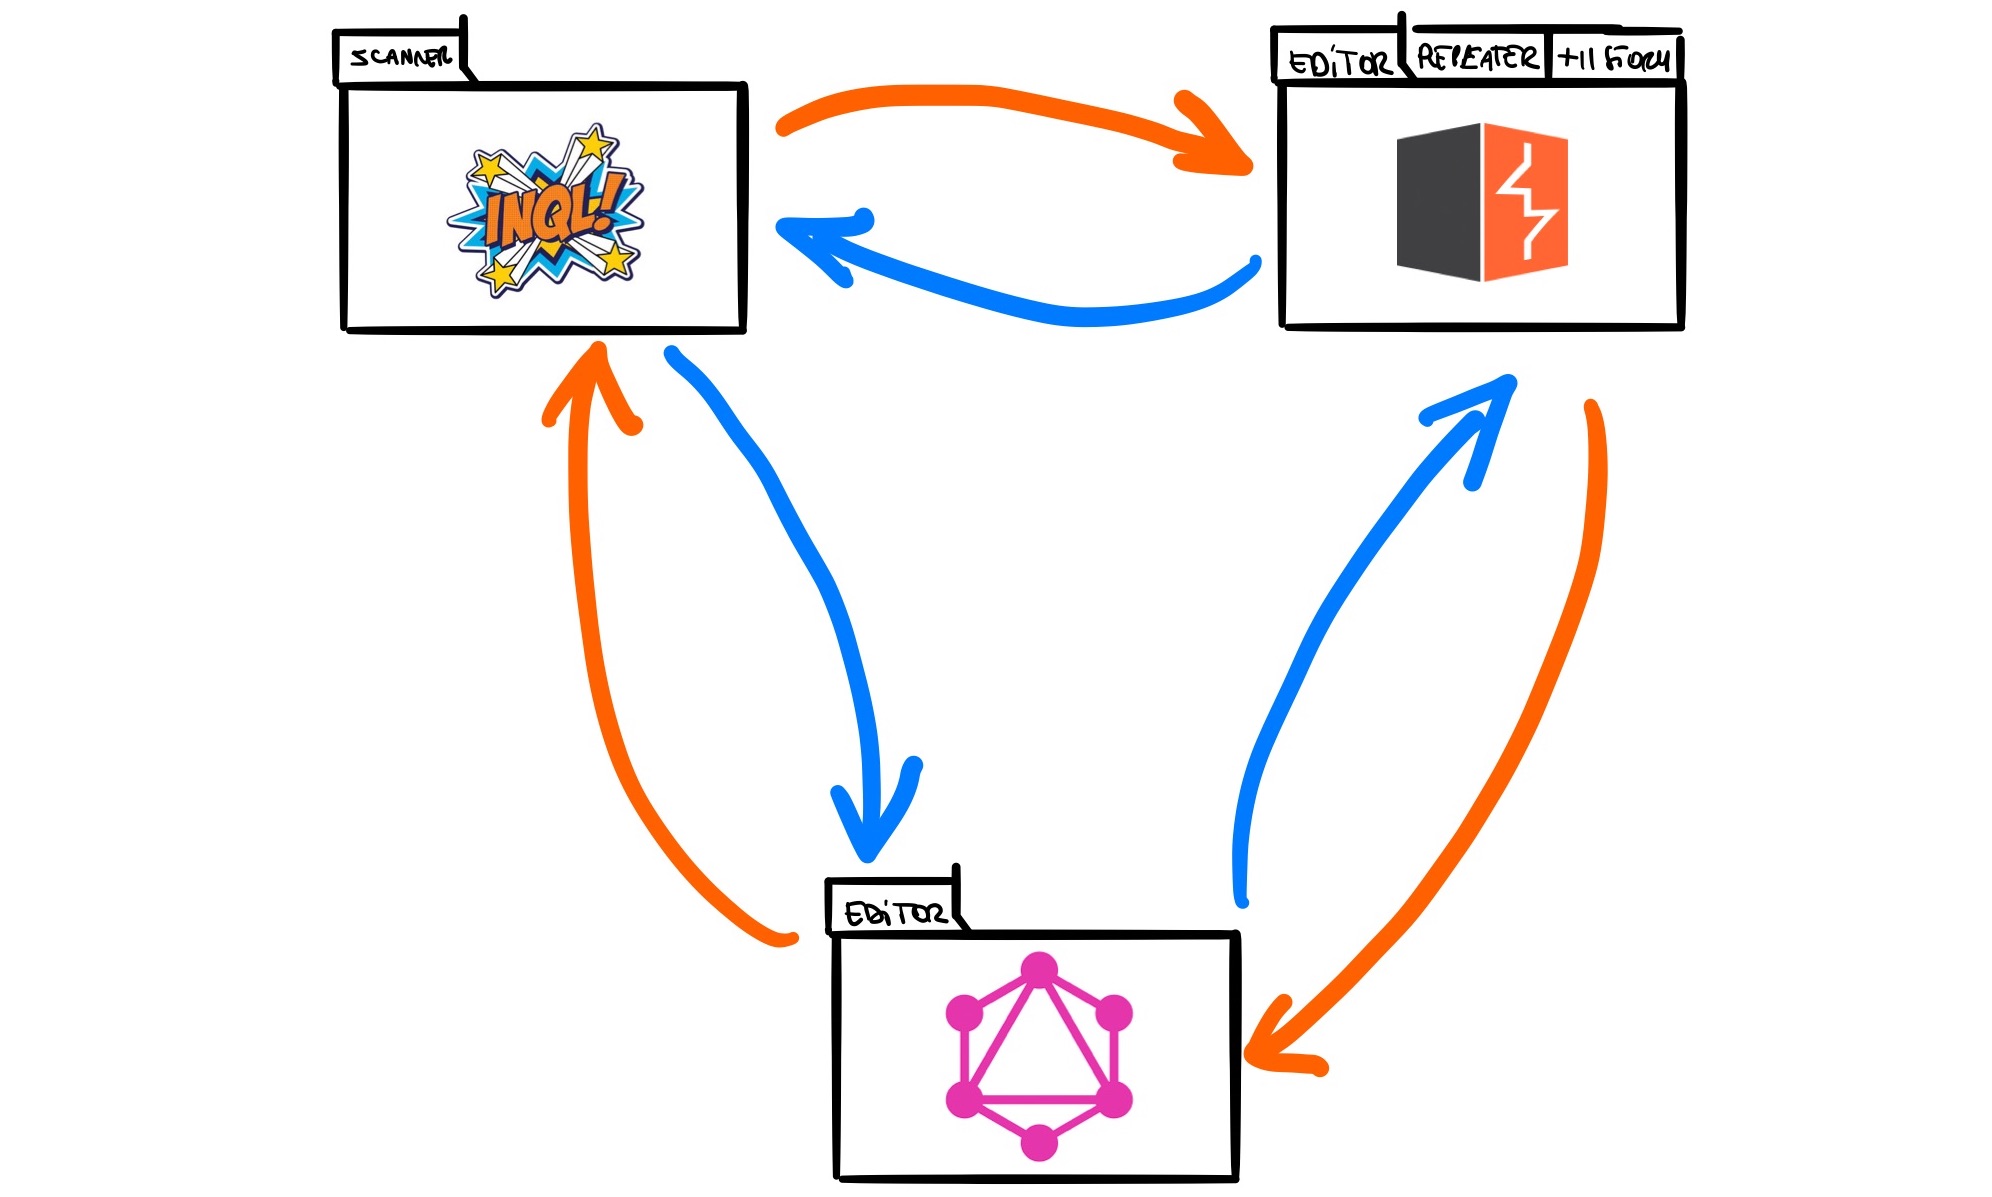
We imagine people working between GraphiQL, InQL and other Burp Suite tools hence we included a custom “Send to GraphiQL” / “Send To Repeater” flow to be able to move queries back and forth between the tools.
But that’s not all. On the Burp Suite extension side, InQL is now handling batched-queries and searching inside queries.
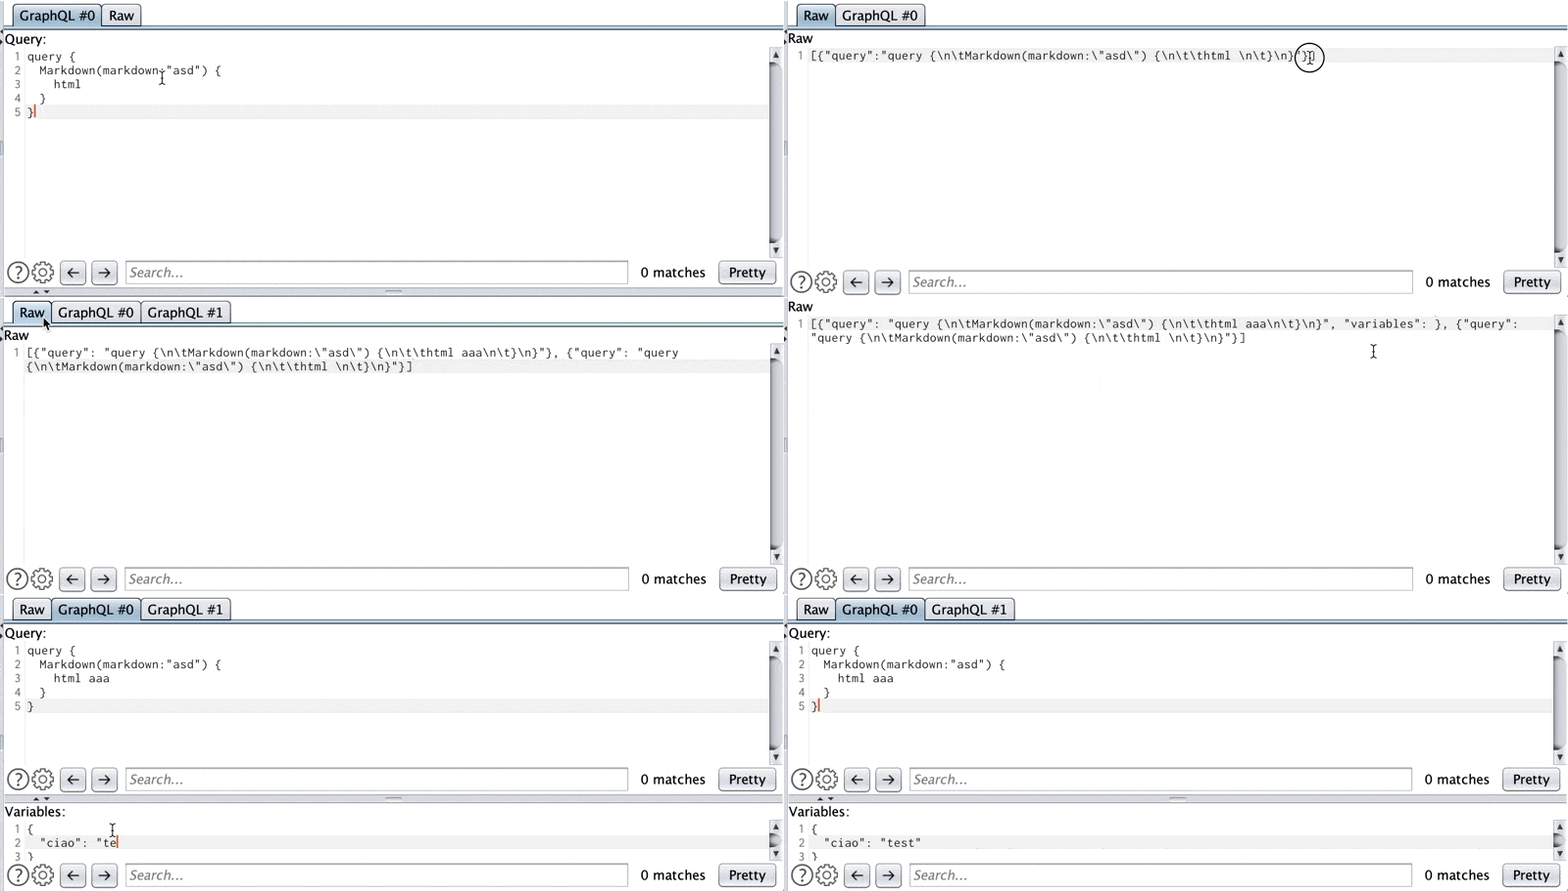
This was possible through re-engineering the editor in use (e.g. the default Burp text editor) and including a new tabbed interface able to sync between multiple representation of these queries.
Finally, InQL is now available on the Burp Suite’s BApp store so that you can easily install the extension from within Burp’s extension tab.
In just three months, InQL has become the go-to utility for GraphQL security testing. We received a lot of positive feedback and decided to double down on the development. We will keep improving the tool based on users’ feedback and the experience we gain through our GraphQL security testing services.
This project was crafted with love in the Doyensec Research Island.
A good part of my research time at Doyensec was devoted to building a flexible ASN.1 grammar-based fuzzer for testing TLS certificate parsers. I learned a lot in the process, but I often struggled to find good resources on these topics. In this blogpost I want to give a high-level overview of the problem, the approach I’m taking, and some pointers which might hopefully save a little time for other fellow security researchers.
Let’s start with some basics.
A TLS certificate is a DER-encoded object conforming to the ASN.1 grammar and constraints defined in RFC 5280, which is based on the ITU X.509 standard.
That’s a lot of information to unpack, let’s take it one piece at a time.
ASN.1 (Abstract Syntax Notation One) is a grammar used to define abstract objects. You can think of it as a much older and more complicated version of Protocol Buffers. ASN.1 however does not define an encoding, which is left to other standards. This language was designed by ITU and it is extremely powerful and general purpose.
This is how a message in a chat protocol might be defined:
Message ::= SEQUENCE {
    senderId     INTEGER,
    recipientId  INTEGER,
    message      UTF8String,
    sendTime     GeneralizedTime,
    ...
}
At this first sight, ASN.1 might even seem quite simple and intuitive. But don’t be fooled! ASN.1 contains a lot of vestigial and complex features. For a start, it has ~13 string types. Constraints can be placed on fields, for instance, integers and the string sizes can be restricted to an acceptable range.
The real complexity beasts however are information objects, parametrization and tabular constraints. Information objects allows the definition of templates for data types and a grammar to declare instances of that template (oh yeah…defining a grammar within a grammar!).
This is how a template for different message types could be defined:
-- Definition of the MESSAGE-CLASS information object class
MESSAGE-CLASS ::= CLASS {
    messageTypeId INTEGER UNIQUE
    &payload      [1] OPTIONAL,
    ...
}
WITH SYNTAX {
    MESSAGE-TYPE-ID  &messageTypeId
    [PAYLOAD    &payload]
}

-- Definition of some message types
TextMessageKinds MESSAGE-CLASS ::= {
    -- Text message
    {MESSAGE-TYPE-ID 0, PAYLOAD UTF8String}
    -- Read ACK (no payload)
  | {MESSAGE-TYPE-ID 1, PAYLOAD Sequence { ToMessageId INTEGER } }
}

MediaMessageKinds MESSAGE-CLASS ::= {
    -- JPEG
    {MESSAGE-TYPE-ID 2, PAYLOAD OctetString}
}
Parametrization allows the introduction of parameters in the specification of a type:
Message {MESSAGE-CLASS : MessageClass} ::= SEQUENCE {
    messageId     INTEGER,
    senderId      INTEGER,
    recipientId   INTEGER,
    sendTime      GeneralizedTime,
    messageTypeId MESSAGE-CLASS.&messageTypeId ({MessageClass}),
    payload       MESSAGE-CLASS.&payload ({MessageClass} {@messageTypeId})
}
While a complete overview of the format is not within the scope of this post, a very good entry-level, but quite comprehensive, resource I found is this ASN1 Survival guide. The nitty-gritty details can be found in the ITU standards X.680 to X.683.
Powerful as it may be, ASN.1 suffers from a large practical problem - it lacks a wide choice of compilers (parser generators), especially non-commercial ones. Most of them do not implement advanced features like information objects. This means that more often than not, data structures defined using ASN.1 are serialized and unserialized by handcrafted code instead of an autogenerated parser. This is also true for many libraries handling TLS certificates.
DER (Distinguished Encoding Rules) is an encoding used to translate an ASN.1 object into bytes. It is a simple Tag-Length-Value format: each element is encoded by appending its type (tag), the length of the payload, and the payload itself. Its rules ensure there is only one valid representation for any given object, a useful property when dealing with digital certificates that must be signed and checked for anomalies.
The details of how DER works are not relevant to this post. A good place to start is here.
The format of the digital certificates used in TLS is defined in some RFCs, most importantly RFC 5280 (and then in RFC 5912, updated for ASN.1 2002). The specification is based on the ITU X.509 standard.
This is what the outermost layer of a TLS certificate contains:
Certificate  ::=  SEQUENCE  {
    tbsCertificate       TBSCertificate,
    signatureAlgorithm   AlgorithmIdentifier,
    signature            BIT STRING
}

TBSCertificate  ::=  SEQUENCE  {
    version         [0]  Version DEFAULT v1,
    serialNumber         CertificateSerialNumber,
    signature            AlgorithmIdentifier,
    issuer               Name,
    validity             Validity,
    subject              Name,
    subjectPublicKeyInfo SubjectPublicKeyInfo,
    issuerUniqueID  [1]  IMPLICIT UniqueIdentifier OPTIONAL,
                         -- If present, version MUST be v2 or v3
    subjectUniqueID [2]  IMPLICIT UniqueIdentifier OPTIONAL,
                         -- If present, version MUST be v2 or v3
    extensions      [3]  Extensions OPTIONAL
                         -- If present, version MUST be v3 --
}
You may recognize some of these fields from inspecting a certificate using a browser integrated viewer.
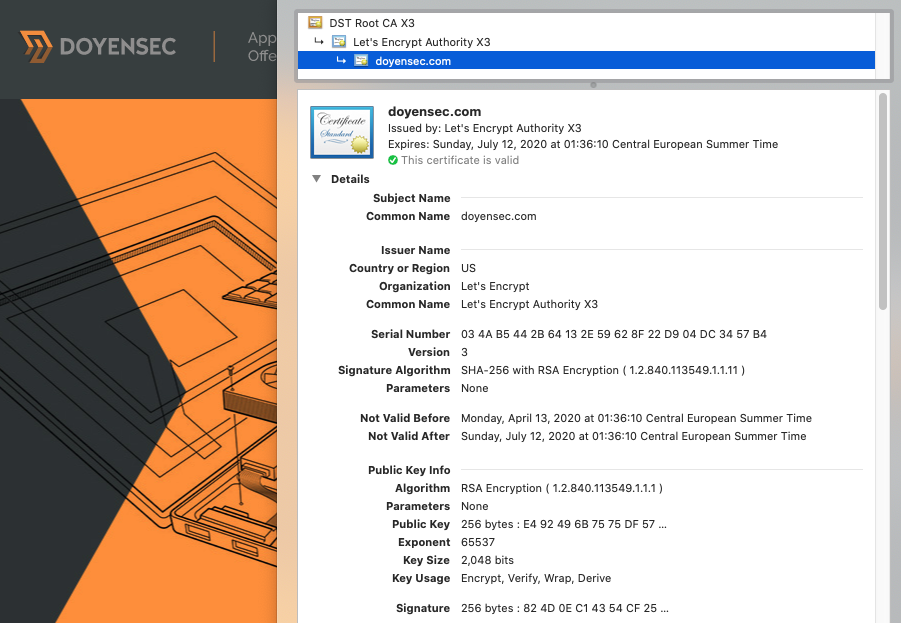
Finding out what exactly should go inside a TLS certificate and how it should be interpreted was not an easy task - specifications were scattered inside a lot of RFCs and other standards, sometimes with partial or even conflicting information. Some documents from the recent past offer a good insight into the number of contradictory interpretations. Nowadays there seems to be more convergence, and a good place to start when looking for how a TLS certificate should be handled is the RFCs together with a couple of widely used TLS libraries.
All the high profile TLS libraries include some fuzzing harnesses directly in their source tree and most are even continuously fuzzed (like LibreSSL which is now included in oss-fuzz thanks to my colleague Andrea). Most libraries use tried-and-tested fuzzers like AFL or libFuzzer, which are not encoding or syntax aware. This very likely means that many cycles are wasted generating and testing inputs which are rejected early by the parsers.
X.509 parsers have been fuzzed using many approaches. Frankencert, for instance, generates certificates by combining parts from existing ones, while CertificateFuzzer uses a hand-coded grammar. Some fuzzing efforts are more targeted towards discovering memory-corruption types of bugs, while others are more geared towards discovering logic bugs, often comparing the behavior of multiple parsers side by side to detect inconsistencies.
I wanted a tool capable of generating valid inputs from an ASN.1 grammar, so that I can slightly break them and hopefully find some vulnerabilities. I couldn’t find any tool accepting ASN.1 grammars, so I decided to build one myself.
After a lot of experimentation and three full rewrites, I have a pipeline that generates valid X509 certificates which looks like this
     +-------+
     | ASN.1 |
     +---+---+
         |
      pycrate
         |
 +-------v--------+        +--------------+
 | Python classes |        |  User Hooks  |
 +-------+--------+        +-------+------+
         |                         |
         +-----------+-------------+
                     |
                 Generator
                     |
                     |
                 +---v---+
                 |       |
                 |  AST  |
                 |       |
                 +---+---+
                     |
                  Encoder
                     |
               +-----v------+
               |            |
               |   Output   |
               |            |
               +------------+
First, I compile the ASN.1 grammar using pycrate, one of the few FOSS compilers that support most of the advanced features of ASN.1.
The output of the compiler is fed into the Generator. With a lot of introspection inside the pycrate classes, this component generates random ASTs conforming to the input grammar.
The ASTs can be fed to an encoder (e.g. DER) to create a binary output suitable for being tested with the target application.
Certificates produced like this would not be valid, because many constraints are not encoded in the syntax. Moreover, I wanted to give the user total freedom to manipulate the generator behavior. To solve this problem I developed a handy hooking system which allows overrides at any point in the generator:
from pycrate_asn1dir.X509_2016 import AuthenticationFramework
from generator import Generator

spec = AuthenticationFramework.Certificate
cert_generator = Generator(spec)

@cert_generator.value_hook("Certificate/toBeSigned/validity/notBefore/.*")
def generate_notBefore(generator: Generator, node):
    now = int(time.time())
    start = now - 10 * 365 * 24 * 60 * 60  # 10 years ago
    return random.randint(start, now)

@cert_generator.node_hook("Certificate/toBeSigned/extensions/_item_[^/]*/" \
                          "extnValue/ExtnType/_cont_ExtnType/keyIdentifier")
def force_akid_generation(generator: Generator, node):
    # keyIdentifier should be present unless the certificate is self-signed
    return generator.generate_node(node, ignore_hooks=True)

@cert_generator.value_hook("Certificate/signature")
def generate_signature(generator: Generator, node):
    # (... compute signature ...)
    return (sig, siglen)
The AST generated by this pipeline can be already used for differential testing. For instance, if a library accepts the certificate while others don’t, there may be a problem that requires manual investigation.
In addition, the ASTs can be mutated using a custom mutator for AFL++ which performs random operations on the tree.
ASN1Fuzz is currently research-quality code, but I do aim at open sourcing it at some point in the future. Since the generation starts from ASN.1 grammars, the tool is not limited to generating TLS certificates, and it could be leveraged in fuzzing a plethora of other protocols.
Stay tuned for the next blog post where I will present the results from this research!
A few months ago I came across a curious design pattern on Google Scholar. Multiple screens of the web application were fetched and rendered using a combination of location.hash parameters and XHR to retrieve the supposed templating snippets from a relative URI, rendering them on the page unescaped.
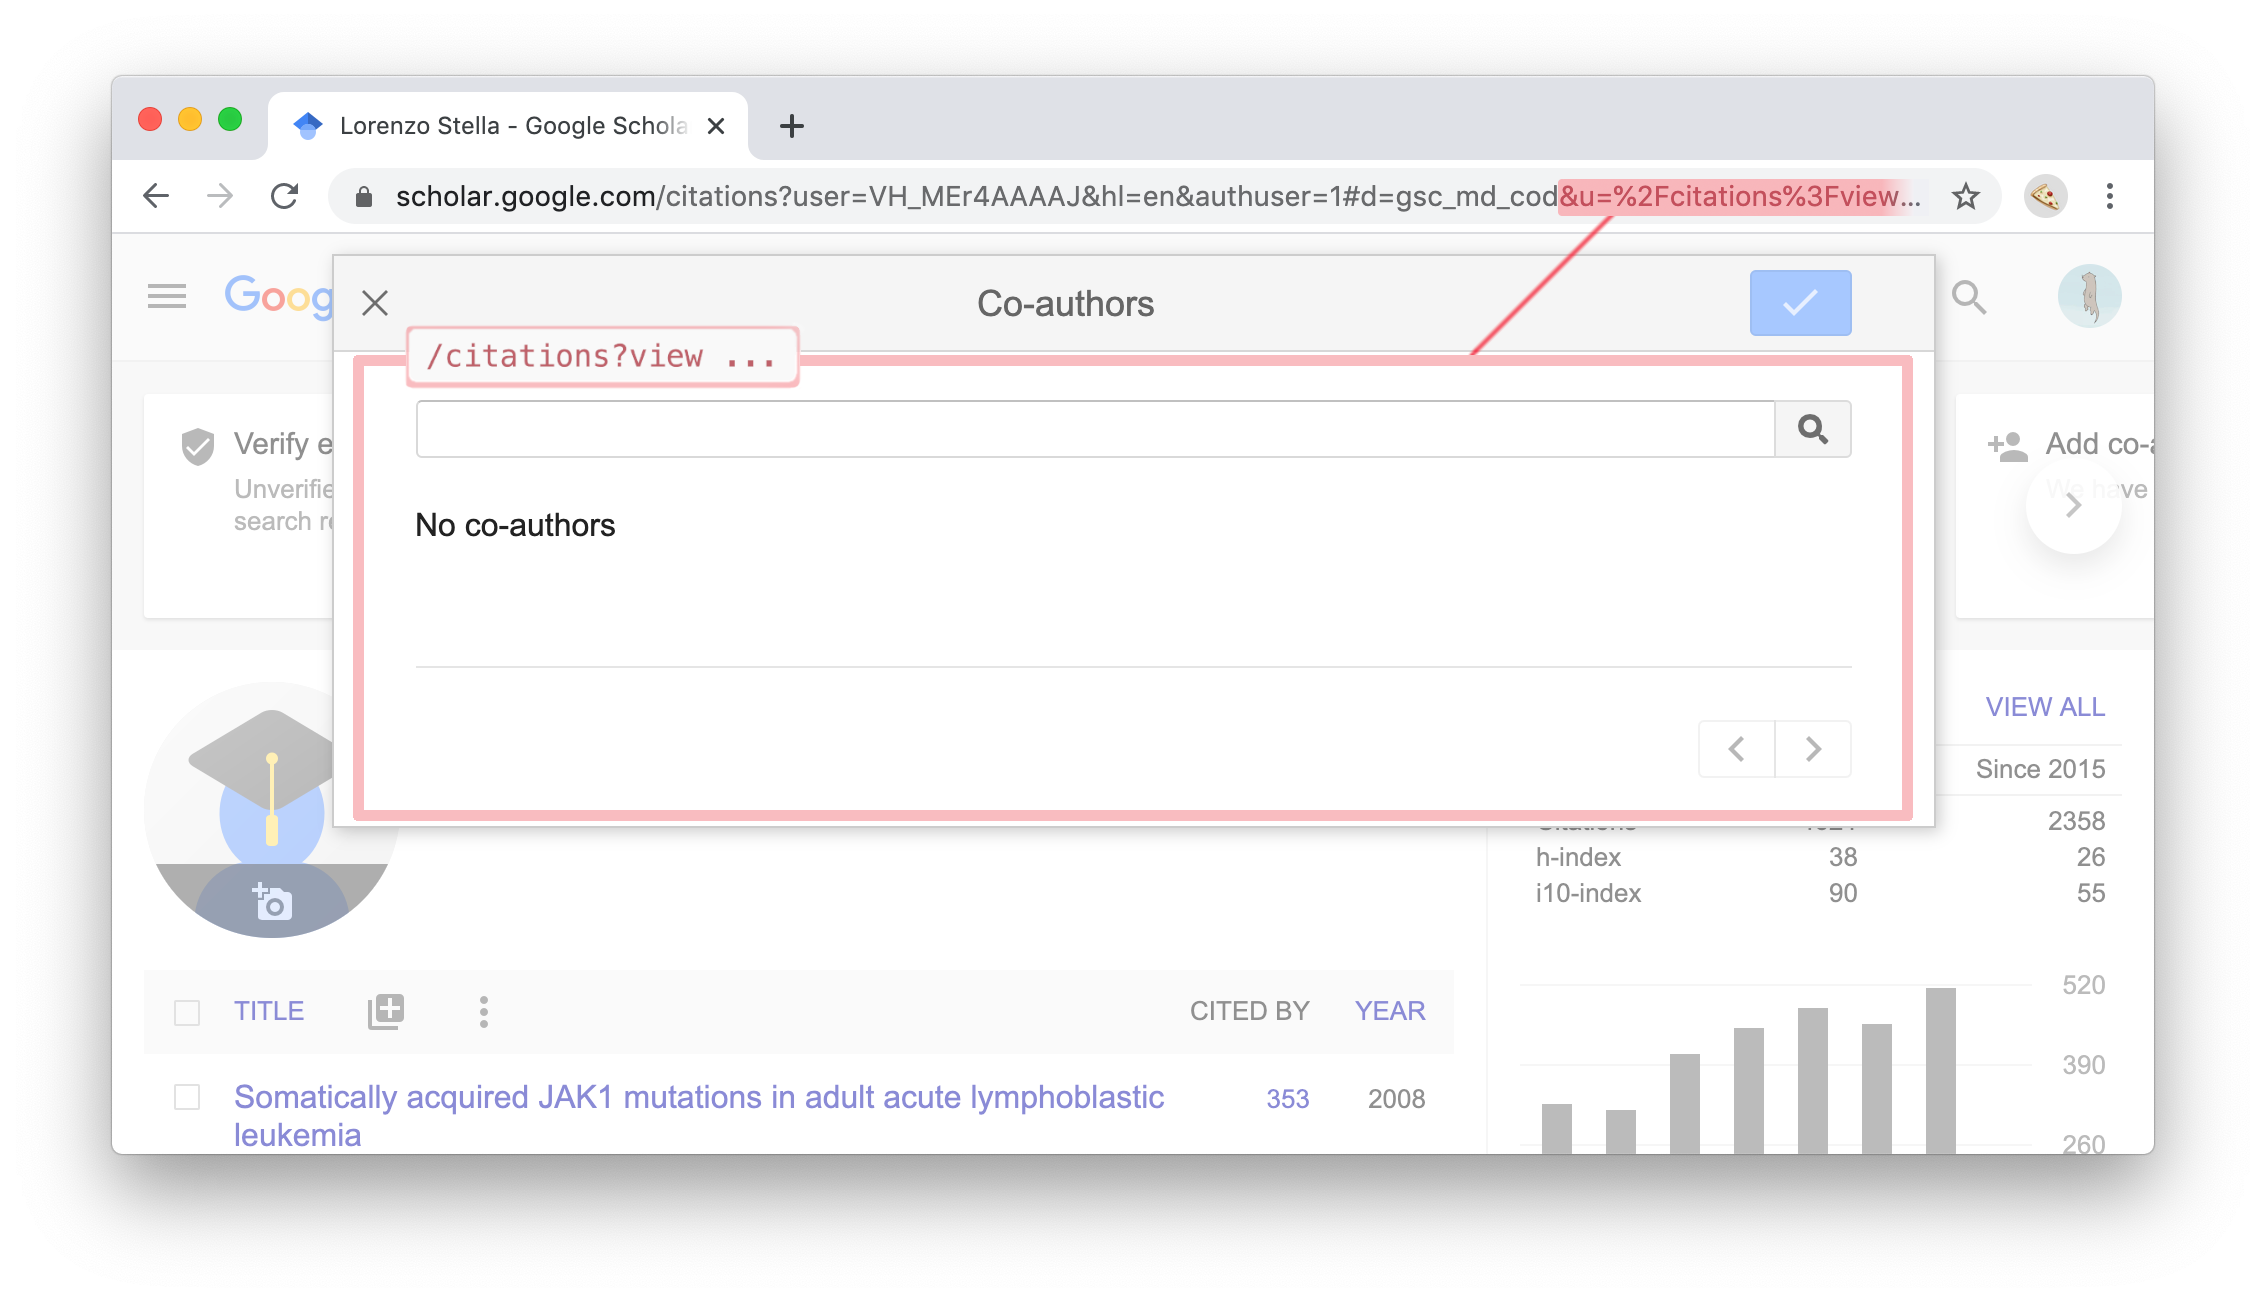
This is not dangerous per se, unless the platform lets users upload arbitrary content and serve it from the same origin, which unfortunately Google Scholar does, given its image upload functionality.
While any penetration tester worth her salt would deem the exploitation of the issue trivial, Scholar’s image processing backend was applying different transformations to the uploaded images (i.e. stripping metadata and reprocessing the picture). When reporting the vulnerability, Google’s VRP team did not consider the upload of a polymorphic image carrying a valid XSS payload possible, and instead requested a PoC||GTFO.
Given the age of this technique, I first went through all past “well-known” techniques to generate polymorphic pictures, and then developed a test suite to investigate the behavior of some of the most popular libraries for image processing (i.e. Imagemagick, GraphicsMagick, Libvips). This effort led to the discovery of some interesting caveats. Some of these methods can also be used to conceal web shells or Javascript content to bypass “self” CSP directives.
The easiest approach is to embed our payload in the metadata of the image. In the case of JPEG/JFIF, these pieces of metadata are stored in application-specific markers (called APPX), but they are not taken into account by the majority of image libraries. Exiftool is a popular tool to edit those entries, but you may find that in some cases the characters will get entity-escaped, so I resorted to inserting them manually.
In the hope of Google’s Scholar preserving some whitelisted EXIFs, I created an image having 1.2k common EXIF tags, including CIPA standard and non-standard tags.


While that didn’t work in my case, some of the EXIF entries are to this day kept in many popular web platforms. In most of the image libraries tested, PNG metadata is always kept when converting from PNG to PNG, while they are always lost from PNG to JPG.
This technique will only work if no transformations are performed on the uploaded image, since only the image content is processed.


As the name suggests, the trick involves appending the JavaScript payload at the end of the image format.
In PNGs, the iDAT chunk stores the pixel information. Depending on the transformations applied, you may be able to directly insert your raw payload in the iDAT chunks or you may try to bypass the resize and re-sampling operations. Google’s Scholar only generated JPG pictures so I could not leverage this technique.
In the JFIF standard, the entropy-coded data segment (ECS) contains the output of the raw Huffman-compressed bitstream which represents the Minimum Coded Unit (MCU) that comprises the image data. In theory, it is possible to position our payload in this segment, but there are no guarantees that our payload will survive the transformation applied by the image library on the server. Creating a JPG image resistant to the transformations caused by the library was a process of trial and error.
As a starting point I crafted a “base” image with the same quality factors as the images resulting from the conversion. For this I ended up using this image having 0-length-string EXIFs. Even though having the payload positioned at a variable offset from the beginning of the section did not work, I found that when processed by Google Scholar the first bytes of the image’s ECS section were kept if separated by a pattern of 0x00 and 0x14 bytes.
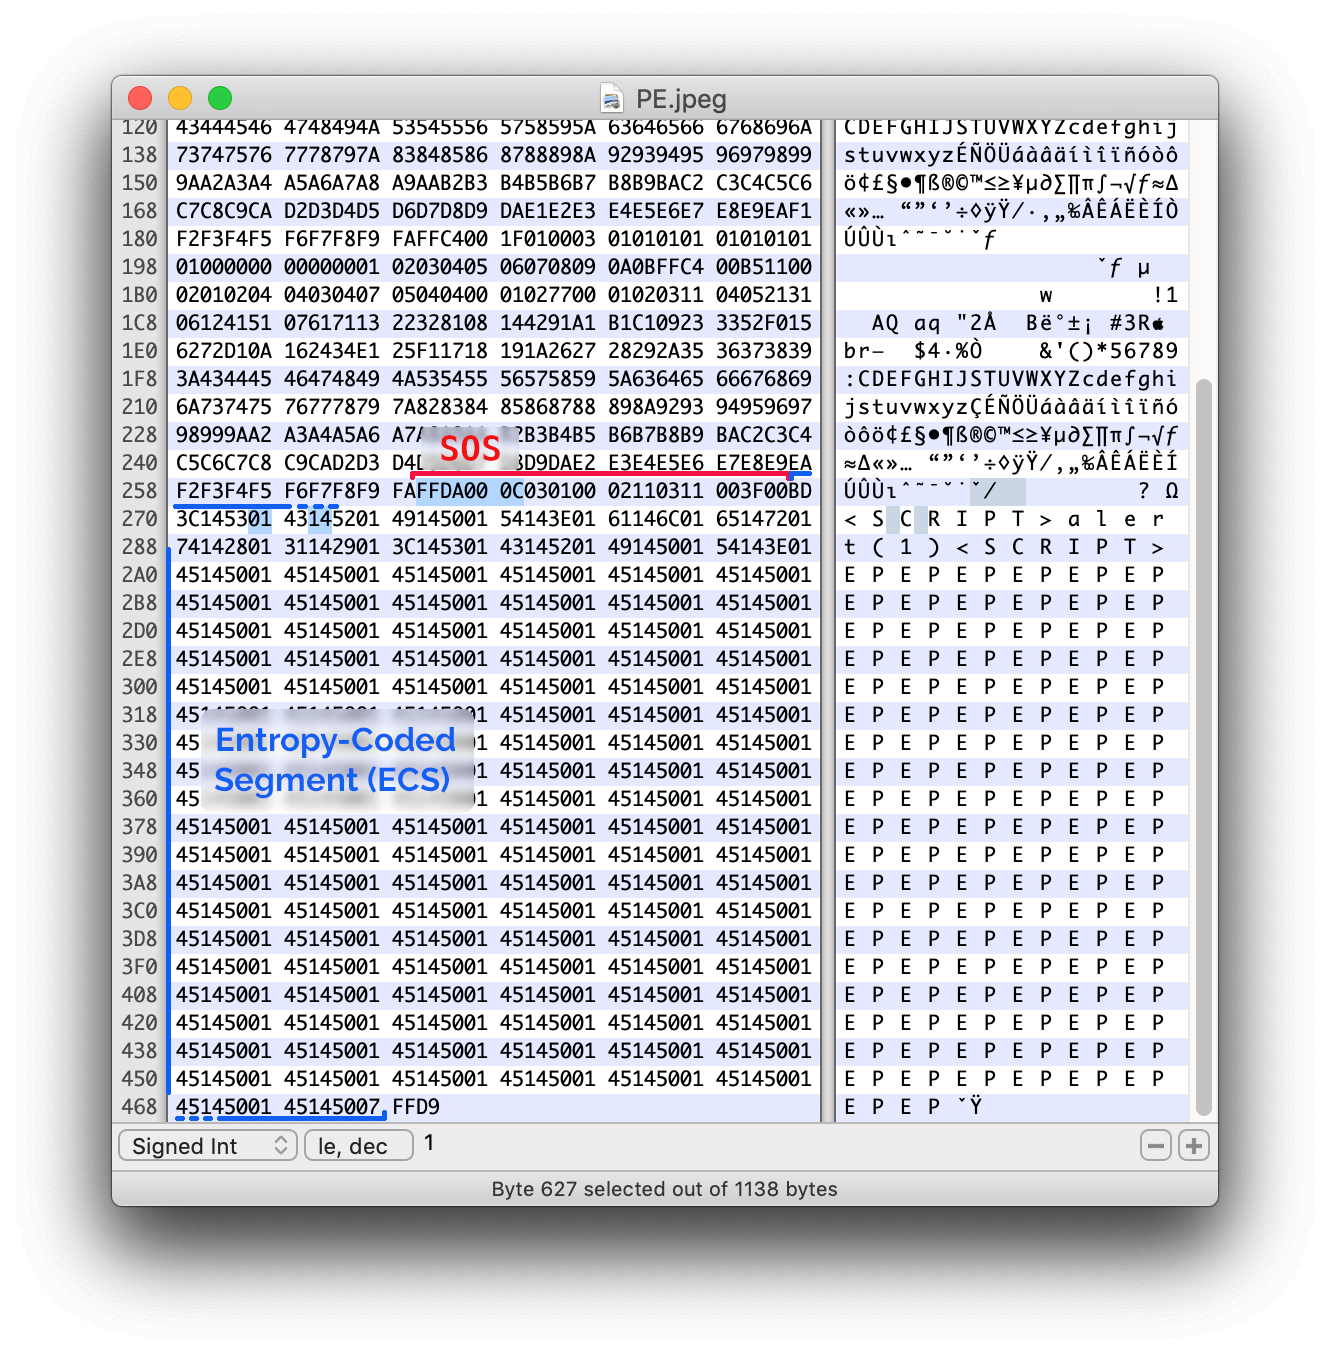
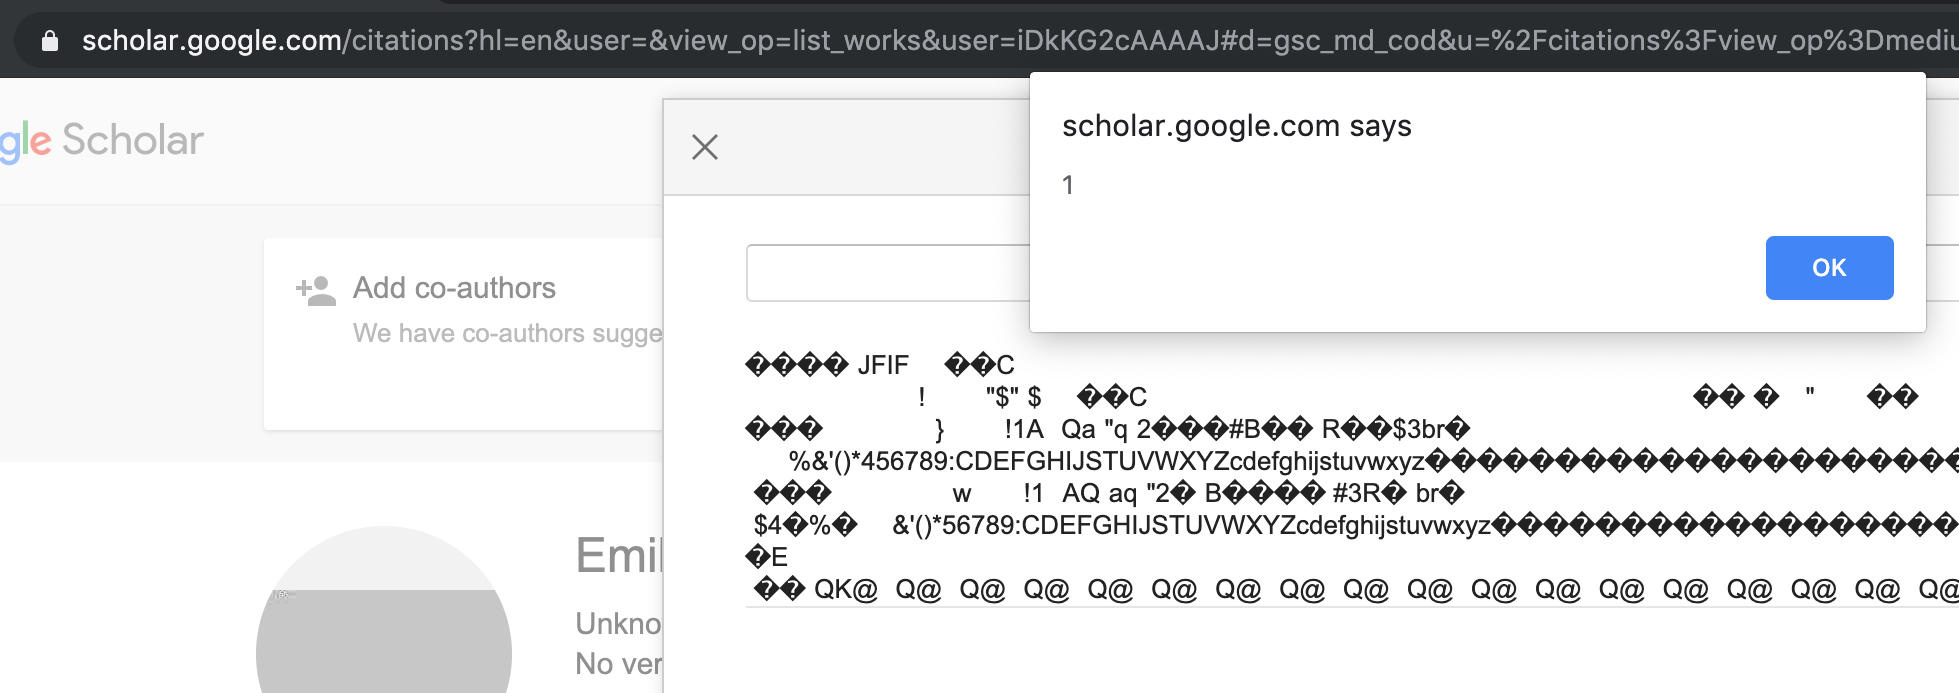
From here it took me a little time to find the right sequence of bytes allowing the payload to survive the transformation, since the majority of user agents were not tolerating low-value bytes in the script tag definition of the page. For anyone interested, we have made available the images embedding the onclick and mouseover events. Our image library test suite is available on Github as doyensec/StandardizedImageProcessingTest.
In my first month at Doyensec I had the opportunity to bring together both my work and my spare time hobbies. I used the 25% research time offered by Doyensec to integrate the LibreSSL library into OSS-Fuzz. LibreSSL is an API compatible replacement for OpenSSL, and after the heartbleed attack, it is considered as a full-fledged replacement of OpenSSL on OpenBSD, macOS and VoidLinux.

Contextually to this research, we were awarded by Google a $10,000 bounty, 100% of which was donated to the Cancer Research Institute. The fuzzer also discovered 14+ new vulnerabilities and four of these were directly related to memory corruption.
In the following paragraphs we will walk through the process of porting a new project over to OSS-Fuzz
from following the community provided steps all the way to the actual code porting and we will also show a vulnerability fixed in 136e6c997f476cc65e614e514ac3bf6ee54fc4b4.
commit 136e6c997f476cc65e614e514ac3bf6ee54fc4b4
Author: beck <>
Date:   Sat Mar 23 18:48:15 2019 +0000

    Add range checks to varios ASN1_INTEGER functions to ensure the
    sizes used remain a positive integer. Should address issue
    13799 from oss-fuzz
    ok tb@ jsing@

 src/lib/libcrypto/asn1/a_int.c    | 56 +++++++++++++++++++++++++++++++++++++++++++++++++++++---
 src/lib/libcrypto/asn1/tasn_prn.c |  8 ++++++--
 src/lib/libcrypto/bn/bn_lib.c     |  4 +++-
 3 files changed, 62 insertions(+), 6 deletions(-)
As a voidlinux maintainer, I’m a long time LibreSSL user and proponent. LibreSSL is a version of the TLS/crypto stack forked from OpenSSL in 2014 with the goals of modernizing the codebase, improving security, and applying best practice development procedures. The motivation for this kind of fork arose after the discovery of the Heartbleed vulnerability.
LibreSSL’s efforts are aimed at removing code considered useless for the target platforms, removing code smells and including additional secure defaults at the cost of compatibility. The LibreSSL codebase is now nearly 70% the size of OpenSSL (237558 cloc vs 335485 cloc), while implementing a similar API on all the major modern operating systems.
Forking is considered a Bad Thing not merely because it implies a lot of wasted effort in the future, but because forks tend to be accompanied by a great deal of strife and acrimony between the successor groups over issues of legitimacy, succession, and design direction. There is serious social pressure against forking. As a result, major forks (such as the Gnu-Emacs/XEmacs split, the fissioning of the 386BSD group into three daughter projects, and the short-lived GCC/EGCS split) are rare enough that they are remembered individually in hacker folklore.
Eric Raymond Homesteading the Noosphere
The LibreSSL effort was generally well received and it now replaces OpenSSL on OpenBSD, macOS since 10.11 and on many other Linux distributions. In the first few years 6 critical vulnerabilities were found in OpenSSL and none of them affected LibreSSL.
Historically, these kinds of forks tend to spawn competing projects which cannot later exchange code, splitting the potential pool of developers between them. However, the LibreSSL team has largely demonstrated of being able to merge and implement new OpenSSL code and bug fixes, all the while slimming down the original source code and cutting down on rarely used or dangerous features.
While the development of LibreSSL appears to be a story with an happy ending, the integration of fuzzing and security auditing into the project was much less so. The Heartbleed vulnerability was like a wakeup call to the industry for tackling the security of libraries that make up the core of the internet. In particular, Google opened up OSS-Fuzz project. OSS-Fuzz is an effort to provide, for free, Google infrastructure to perform fuzzing against the most popular open source libraries. One of the first projects performing these tests was in fact Openssl.
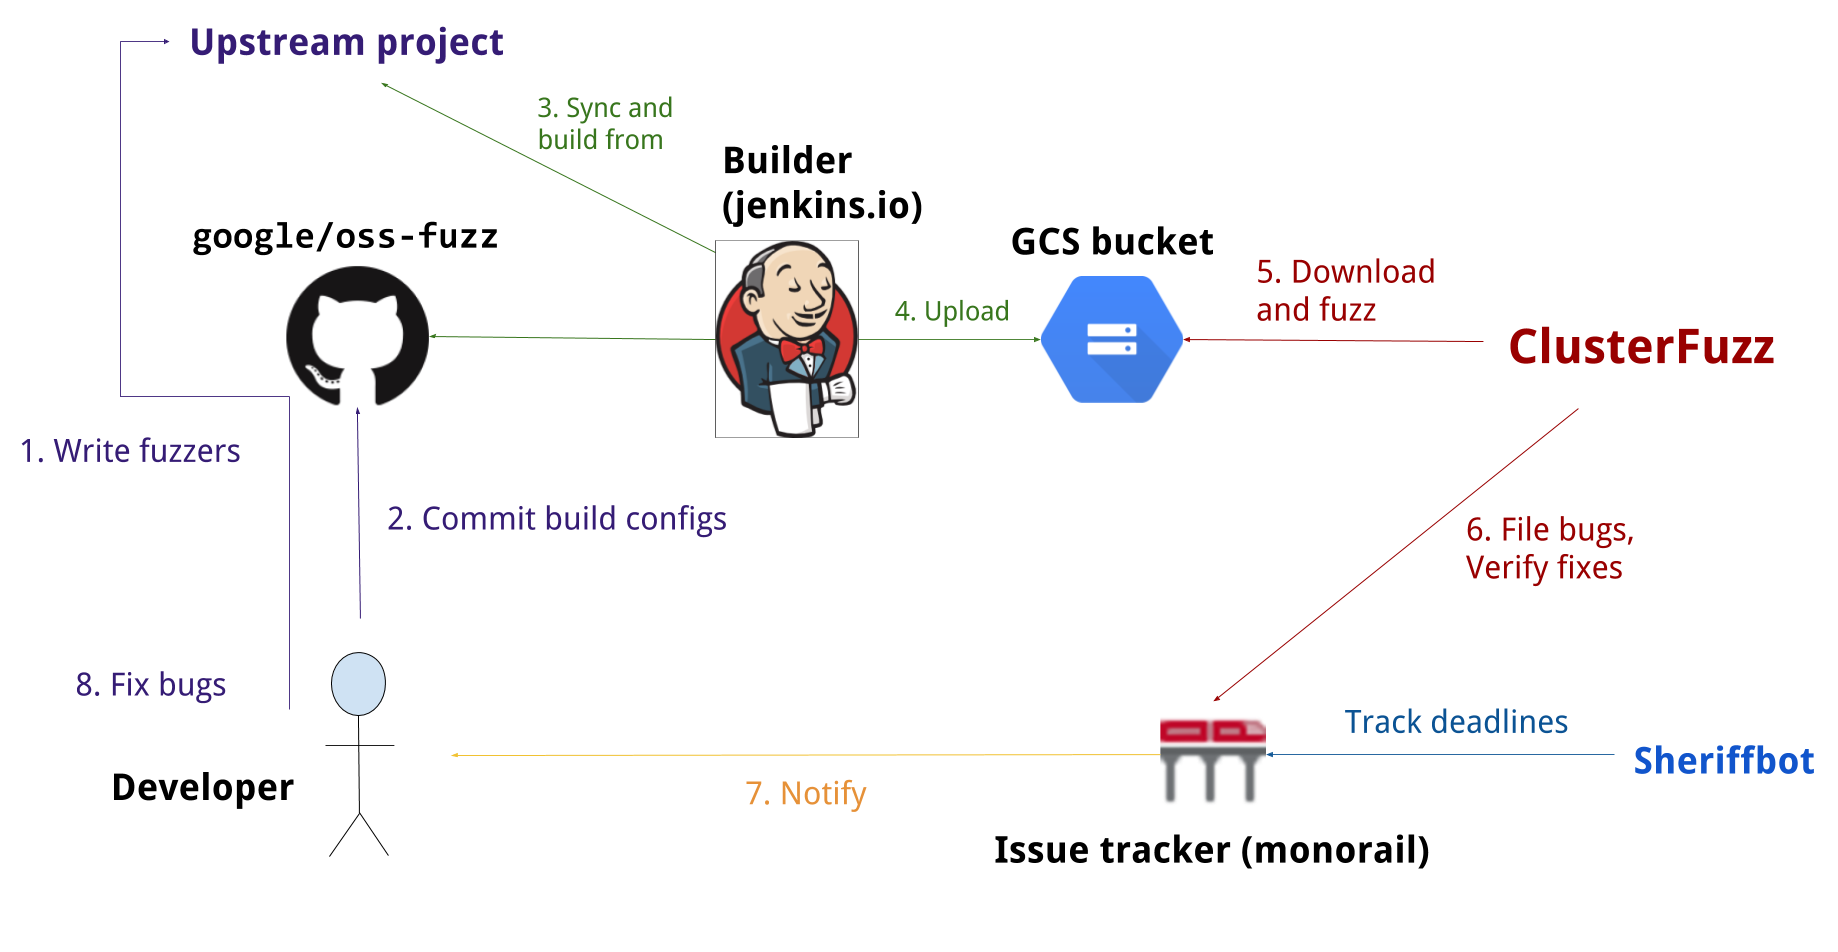
Fuzz testing is a well-known technique for uncovering programming errors in software.
Many of these detectable errors, like buffer overflows, can have serious security implications.
OpenSSL included fuzzers in c38bb72797916f2a0ab9906aad29162ca8d53546 and was integrated into OSS-Fuzz later in 2016.
commit c38bb72797916f2a0ab9906aad29162ca8d53546
Refs: OpenSSL_1_1_0-pre5-217-gc38bb72797
Author:     Ben Laurie <ben@links.org>
AuthorDate: Sat Mar 26 17:19:14 2016 +0000
Commit:     Ben Laurie <ben@links.org>
CommitDate: Sat May 7 18:13:54 2016 +0100
    Add fuzzing!
Since both LibreSSL and OpenSSL share most of their codebase, with LibreSSL mainly implementing a secure subset of OpenSSL, we thought porting the OpenSSL fuzzers to LibreSSL would have been a fun and useful project. Moreover, this resulted in the discovery of several memory related corruption bugs.
To be noted, the following details won’t replace the official OSS-Fuzz guide but will instead help in selecting a good target project for OSS-Fuzz integration. Generally speaking applying for a new OSS-Fuzz integration proceeds in four logical steps:
We were awarded a bounty, and we helped to protect the Internet just a little bit more. You should do it too!
After a crash was found, OSS-Fuzz infrastructure provides a minimized test case which can be inspected by an analyst. The issue was found in the ASN1 parser. ASN1 is a formal notation used for describing data transmitted by telecommunications protocols, regardless of language implementation and physical representation of these data, whether complex or very simple. Coincidentally, it is employed for x.509 certificates, which represents the technical base for building public-key infrastructure.
Passing our testcase 0202 ff25 through dumpasn1 it’s possible to see how it errors out saying that the integer of length 2 (bytes) is encoded with a negative value.
This is not allowed in ASN1, and it should not even be allowed in LibreSSL. However, as discovered by OSS-Fuzz, this test crashes the Libressl parser.
$ xxd ./test
xxd ../test
00000000: 0202 ff25                                ...%
$ dumpasn1 ./test
  0   2: INTEGER 65317
       :   Error: Integer is encoded as a negative value.

0 warnings, 1 error.
Since the LibreSSL implementation was not guarded against negative integers, trying to covert the ASN1 integer crafted a negative to an internal representation of BIGNUM and causes an uncontrolled over-read.
AddressSanitizer:DEADLYSIGNAL
    =================================================================
    ==1==ERROR: AddressSanitizer: SEGV on unknown address 0x00009fff8000 (pc 0x00000058a308 bp 0x7ffd3e8b7bb0 sp 0x7ffd3e8b7b40 T0)
    ==1==The signal is caused by a READ memory access.
    SCARINESS: 20 (wild-addr-read)
        #0 0x58a307 in BN_bin2bn libressl/crypto/bn/bn_lib.c:601:19
        #1 0x6cd5ac in ASN1_INTEGER_to_BN libressl/crypto/asn1/a_int.c:456:13
        #2 0x6a39dd in i2s_ASN1_INTEGER libressl/crypto/x509v3/v3_utl.c:175:16
        #3 0x571827 in asn1_print_integer_ctx libressl/crypto/asn1/tasn_prn.c:457:6
        #4 0x571827 in asn1_primitive_print libressl/crypto/asn1/tasn_prn.c:556
        #5 0x571827 in asn1_item_print_ctx libressl/crypto/asn1/tasn_prn.c:239
        #6 0x57069a in ASN1_item_print libressl/crypto/asn1/tasn_prn.c:195:9
        #7 0x4f4db0 in FuzzerTestOneInput libressl.fuzzers/asn1.c:282:13
        #8 0x7fd3f5 in fuzzer::Fuzzer::ExecuteCallback(unsigned char const*, unsigned long) /src/libfuzzer/FuzzerLoop.cpp:529:15
        #9 0x7bd746 in fuzzer::RunOneTest(fuzzer::Fuzzer*, char const*, unsigned long) /src/libfuzzer/FuzzerDriver.cpp:286:6
        #10 0x7c9273 in fuzzer::FuzzerDriver(int*, char***, int (*)(unsigned char const*, unsigned long)) /src/libfuzzer/FuzzerDriver.cpp:715:9
        #11 0x7bcdbc in main /src/libfuzzer/FuzzerMain.cpp:19:10
        #12 0x7fa873b8282f in __libc_start_main /build/glibc-Cl5G7W/glibc-2.23/csu/libc-start.c:291
        #13 0x41db18 in _start
This “wild” address read may be employed by malicious actors to perform leaks in security sensitive context. The Libressl maintainers team not only addressed the vulnerability promptly but also included an ulterior protection in order to guard against missing ASN1_PRIMITIVE_FUNCS in 46e7ab1b335b012d6a1ce84e4d3a9eaa3a3355d9.
commit 46e7ab1b335b012d6a1ce84e4d3a9eaa3a3355d9
Author: jsing <>
Date:   Mon Apr 1 15:48:04 2019 +0000

    Require all ASN1_PRIMITIVE_FUNCS functions to be provided.

    If an ASN.1 item provides its own ASN1_PRIMITIVE_FUNCS functions, require
    all functions to be provided (currently excluding prim_clear). This avoids
    situations such as having a custom allocator that returns a specific struct
    but then is then printed using the default primative print functions, which
    interpret the memory as a different struct.
Fuzzing, despite being seen as one of the easiest ways to discover security vulnerabilities, still works very well. Even if OSS-Fuzz is especially tailored to open source projects, it can also be
adapted to closed source projects. In fact, at the cost of implementing the LLVMFuzzerOneInput interface, it integrates all the latest and greatest clang/llvm fuzzer technology.
As Dockerfile language improves enormously on the devops side, we strongly believe that the OSS-Fuzz fuzzing
interface definition language should be employed in every non-trivial closed source project too. If you need help, contact us for your security automation projects!
As always, this research was funded thanks to the 25% research time offered at Doyensec. Tune in again for new episodes!