ABOUT US
We are security engineers who break bits and tell stories.
Visit us
doyensec.com
Follow us
@doyensec
Engage us
info@doyensec.com
Blog Archive
© 2024 Doyensec LLC 
We are releasing a previously internal-only tool to improve Infrastructure as Code (IaC) analysis and enhance Visual Studio Code allowing real-time collaboration during manual code analysis activities. We’re excited to announce that PoIEx is now available on Github.
Nowadays, cloud-oriented solutions are no longer a buzzword, cloud providers offer ever more intelligent infrastructure services, handling features ranging from simple object storage to complex tasks such as user authentication and identity access management. With the growing complexity of cloud infrastructure, the interactions between application logic and infrastructure begin to play a critical role in ensuring application security.
With many recent high-profile incidents resulting from an insecure combination of web and cloud related technologies, focusing on the points where they meet is crucial to discover new bugs.
PoIEx is a new Visual Studio Code extension that aids testers in analyzing interactions between code and infrastructure by enumerating, plotting and connecting the so called Points of Intersection.
A Point of Intersection (PoI) marks where the code interacts with the underlying cloud infrastructure, revealing connections between the implemented logic and the Infrastructure as Code (IaC) defining the configuration of the involved cloud services.
Enumerating PoIs is crucial while performing manual reviews to find hybrid cloud-web vulnerabilities exploitable by tricking the application logic into abusing the underlying infrastructure service.
PoIEx identifies and visualizes PoIs, allowing security engineers and cloud security specialists to better understand and identify security vulnerabilities in cloud-oriented applications.
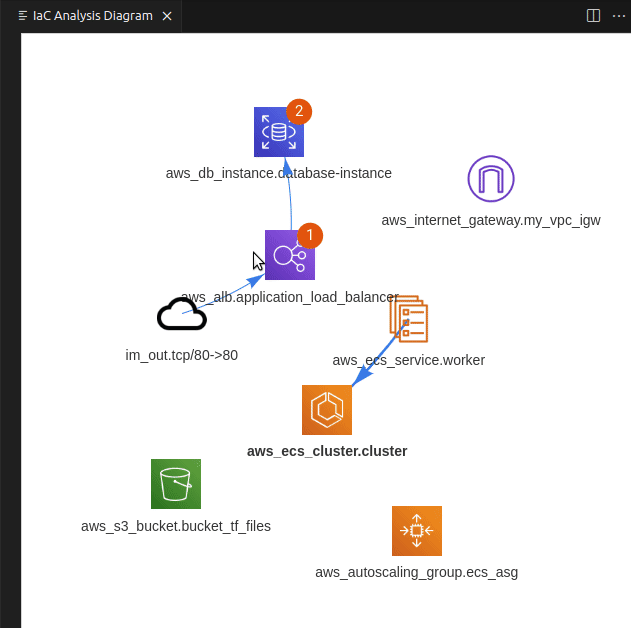
PoIEx scans the application code and the IaC definition at the same time, leveraging Semgrep and custom rulesets, finds code sections that are IaC-relevant, and visualizes results in a nice and user-friendly view. Engineers can navigate the infrastructure diagram and quickly jump to the relevant application code sections where the selected infrastructure resource is used.
If you use VSCode to audit large codebases you may have noticed that all of its features are tailored towards the needs of the developer community. At Doyensec we have solved this issue with PoiEx. The extension enhances VSCode with all the features required to efficiently perform code reviews, such as advanced collaboration capabilities, notes taking using the VS Code Comments API and integration with Semgrep, allowing it to be used also as a standalone Semgrep and project collaboration tool, without any of its IaC-specific features.
At Doyensec, we use PoIEx as a collaboration and review-enhancement tool.
Below we introduce the non-IaC related features, along with our use cases.
PoIEx adds commenting capabilities to VSCode. Users can place sticky notes to any code locations without editing the codebase.
At Doyensec, we usually organize threads with a naming convention involving prefixes like: VULN, LEAD, TODO, etc. We have found that placing shared annotations directly on the codebase greatly improves efficiency when multiple testers are working on the same project.
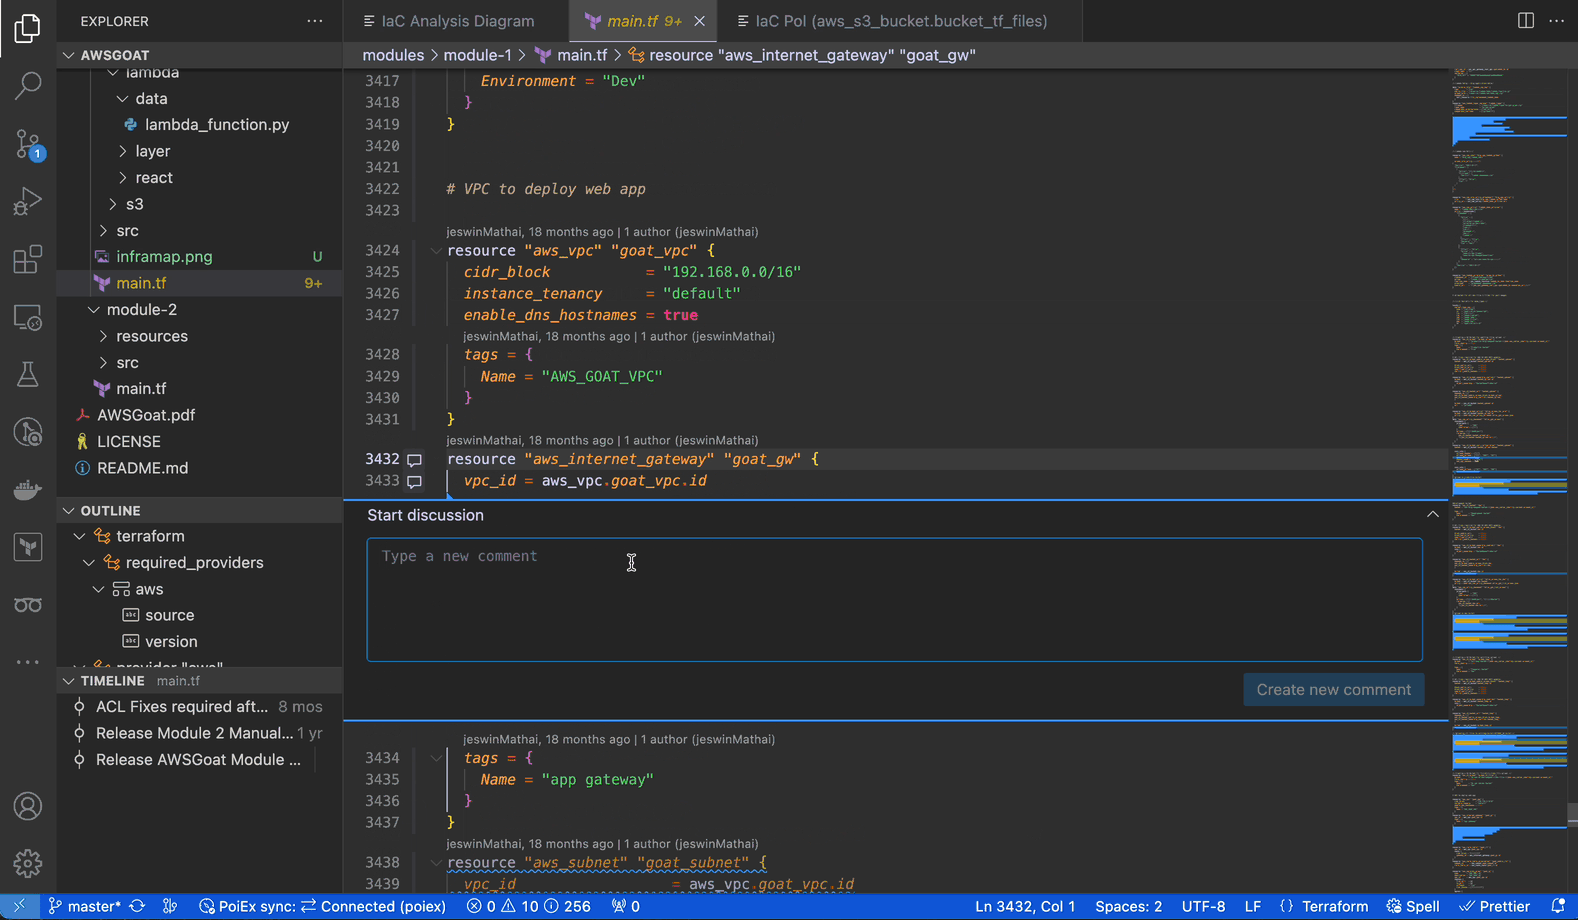
In collaboration mode, members receive an interactive notification for every reply or thread creation, enabling real-time sync among the reviewers about leads, notes and vulnerabilities.
PoIEx works also as a standalone VSCode extension for Semgrep. PoIEx allows the user to scan the entire workspace and presents Semgrep findings nicely in the VSCode “Problems” tab.
Moreover, by right-clicking the issue, it is possible to apply a flag and update its status as: ❌ false positive,🔥 Hot or ` ✅ resolved`. The status is synced in collaboration mode to avoid duplicating checks.
The extension settings allow the user to setup custom arguments for Semgrep. As an example we currently use --config /path/to/your/custom-semgrep-rules --metrics off to turn off metrics and set it use our custom rules.
The scan can be started from the extension side-menu and the results are explorable from the VS Code problems sub-menu. Users can use the built-in search functionality in a smart way to find interesting leads.
PoIEx allows for real-time synchronization of findings and comments with other users. When using collaboration features, a MongoDB instance needs to be shared across all collaborators of the team.
The project-oriented design allows us to map projects and share an encryption key with the testers assigned to a specific activity. This design feature ensures that sensitive data is encrypted at rest.
Comments and scan results are synced to a MongoDB instance, while the codebase remains local and each reviewer must share the same version.
In case you are not familiar with it, CloudSec Tidbits is our blogpost series showcasing interesting real-world bugs found by Doyensec during cloud security testing activities. The blog posts & labs can be found in this repository.
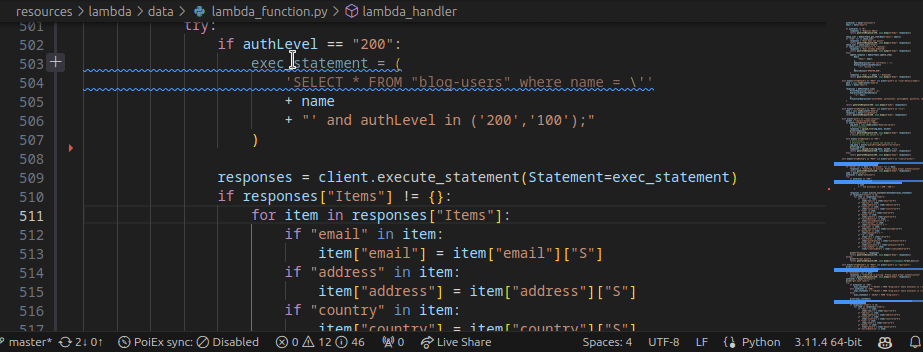
Episode 1 describes a specific type of vulnerability affecting the application logic when user-input is used to instantiate the AWS SDK client. Without proper checks, the user could be able to force the app to use the instance role, instead of external credentials, to interact with the AWS service. Depending on the functionality, such a flaw could allow unwanted actions against the internal infrastructure.
Below, we are covering the issue identification in a code review, as soon as the codebase is opened and explored with PoIEx.
Once downloaded and opened in VS Code, examine the codebase for Lab 1, by using PoIEx to run Semgrep and show the infrastructure diagram by selecting the main.tf file. The result should be similar to the following one.
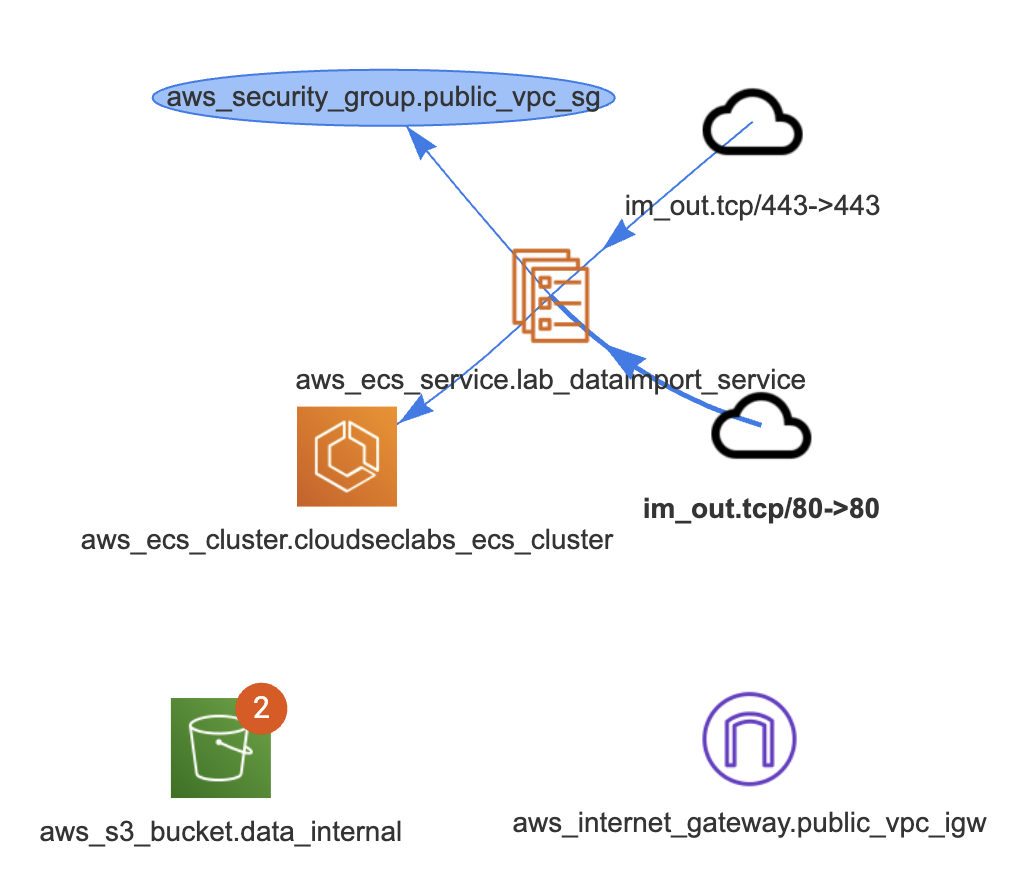
The notifications on aws_s3_bucket.data_internal represent two findings for that bucket.
By clicking on it, a new tab is opened to visualize them.
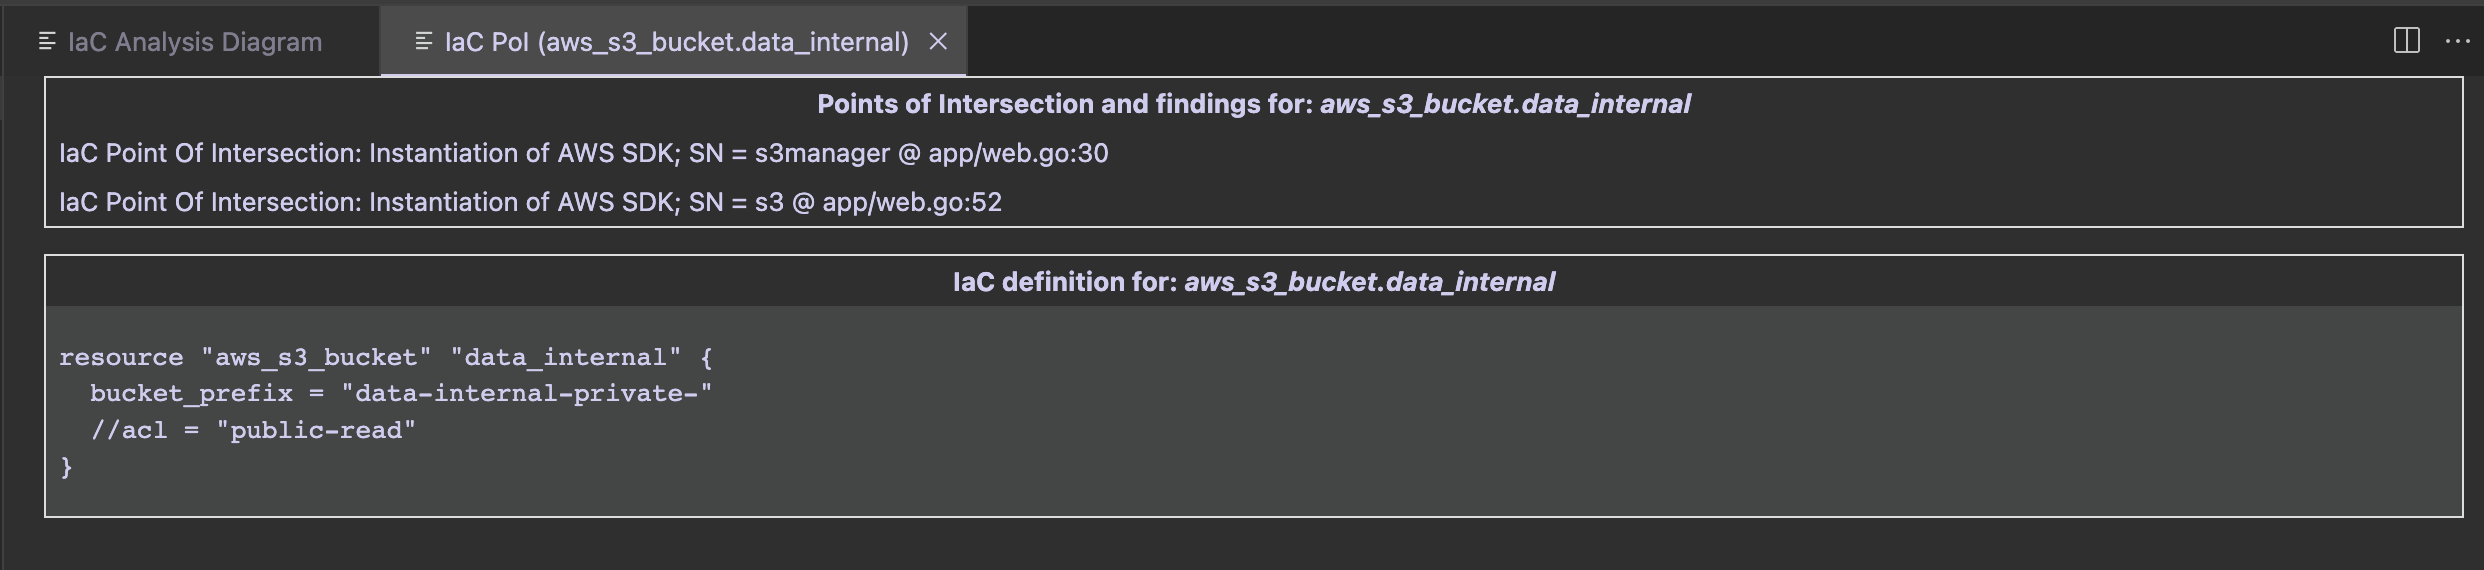
The first group contains PoIs and Semgrep findings, while the second group contains the IaC definition of the clicked entity.
In that case we see that there is an S3 PoI in app/web.go:52. Once clicked, we are redirected at the GetListObjects function defined at web.go#L50. While it is just listing the files in an S3 bucket, both the SDK client config and bucket name are passed as parameters in its signature.
A quick search for its usages will show the vulnerable code
//*aws config initialization
aws_config := &aws.Config{}

if len(imptdata.AccessKey) == 0 || len(imptdata.SecretKey) == 0 {
	fmt.Println("Using nil value for Credentials")
	aws_config.Credentials = nil
} else {
	fmt.Println("Using NewStaticCredentials")
	aws_config.Credentials = credentials.NewStaticCredentials(imptdata.AccessKey, imptdata.SecretKey, "")
}
//list of all objects
allObjects, err := GetListObjects(session_init, aws_config, *aws.String(imptdata.BucketName))
If the aws_config.Credentials is set to nilbecause of a missing key/secret in the input, the credentials provider chain will be used and the instance’s IAM role is assumed. In that case, the automatically retrieved credentials have full access to internal S3 buckets. Quickly jump to the TF definition from the S3 bucket results tab.
After the listing, the DownloadContent function is executed (at web.go line 129 ) and the bucket’s contents are exposed to the user.
At this point, the reviewer knows that if the function is called with an empty AWS Key or Secret, the import data functionality will end up downloading the content with the instance’s role, hence allowing internal bucket names as input.
To exploit the vulnerability, hit the endpoint /importData with empty credentials and the name of an internal bucket (solution at the beginning of Cloudsec Tidbits episode 2).
This project was made with love on the Doyensec Research Island by Michele Lizzit for his master thesis at ETH Zurich under the mentoring of Francesco Lacerenza.
Check out PoIEx! Install the last release from GitHub and contribute with a star, bug reports or suggestions.
During testing activities, we usually analyze the design choices and context needs in order to suggest applicable remediations depending on the different Kubernetes deployment patterns. Scheduling is often overlooked in Kubernetes designs. Typically, various mechanisms take precedence, including, but not limited to, admission controllers, network policies, and RBAC configurations.
Nevertheless, a compromised pod could allow attackers to move laterally to other tenants running on the same Kubernetes node. Pod-escaping techniques or shared storage systems could be exploitable to achieve cross-tenant access despite the other security measures.
Having a security-oriented scheduling strategy can help to reduce the overall risk of workload compromise in a comprehensive security design. If critical workloads are separated at the scheduling decision, the blast radius of a compromised pod is reduced. By doing so, lateral movements related to the shared node, from low-risk tasks to business-critical workloads, are prevented.

Kubernetes provides multiple mechanisms to achieve isolation-oriented designs like node tainting or affinity. Below, we describe the scheduling mechanisms offered by Kubernetes and highlight how they contribute to actionable risk reduction.
The following methods to apply a scheduling strategy will be discussed:
nodeSelector field matching against node labels;
nodeName and namespace fields, basic and effective;
Affinity and anti-affinity, constraints type expansion for inclusion and repulsion;
Inter-pod affinity and anti-affinity, which focus labels matching on pods labels instead of nodes labels when dealing with inclusion and repulsion;
Taints and Tolerations, allowing a node to repel or tolerate a pod being scheduled;
pod topology spread constraints, based on regions, zones, nodes, and other user-defined topology domains;
Design a Custom Scheduler, tailored to your security needs
As mentioned earlier, isolating tenant workloads from each other helps in reducing the impact of a compromised neighbor. That happens because all pods running on a certain node will belong to a single tenant. Consequently, an attacker capable of escaping from a container will only have access to the containers and the volumes mounted to that node.
Additionally, multiple applications with different authorizations may lead to privileged pods sharing the node with pods having PII data mounted or a different security risk level.
Among the constraints, it is the simplest one operating by just specifying the target node labels inside the pod specification.
Example pod Spec
apiVersion: v1
kind: pod
metadata:
  name: nodeSelector-pod
spec:
  containers:
  - name: nginx
    image: nginx:latest
  nodeSelector:
    myLabel: myvalue
If multiple labels are specified, they are treated as required (AND logic), hence scheduling will happen only on pods respecting all of them.
While it is very useful in low-complexity environments, it could easily become a bottleneck stopping executions if many selectors are specified and not satisfied by nodes. Consequently, it requires good monitoring and dynamic management of the labels assigned to nodes if many constraints need to be applied.
If the nodeName field in the Spec is set, the kube scheduler simply passes the pod to the kubelet, which then attempts to assign the pod to the specified node.
In that sense, nodeName overwrites other scheduling rules (e.g., nodeSelector,affinity, anti-affinity etc.) since the scheduling decision is pre-defined.
Example pod spec
apiVersion: v1
kind: pod
metadata:
  name: nginx
spec:
  containers:
  - name: nginx
    image: nginx:latest
  nodeName: node-critical-workload
Limitations:
Consequently, it requires a detailed management of the available nodes and allocated resources for each group of workloads since the scheduling is pre-defined.
Note: De-facto such an approach invalidates all the computational efficiency benefits of the scheduler and it should be only applied on small groups of critical workloads easy to manage.
The NodeAffinity feature enables the possibility to specify rules for pod scheduling based on some characteristics or labels of nodes. They can be used to ensure that pods are scheduled onto nodes meeting specific requirements (affinity rules) or to avoid scheduling pods in specific environments (anti-affinity rules).
Affinity and anti-affinity rules can be set as either “preferred” (soft) or “required” (hard):
If it’s set as preferredDuringSchedulingIgnoredDuringExecution, this indicates a soft rule. The scheduler will try to adhere to this rule, but may not always do so, especially if adhering to the rule would make scheduling impossible or challenging.
If it’s set as requiredDuringSchedulingIgnoredDuringExecution, it’s a hard rule. The scheduler will not schedule the pod unless the condition is met. This can lead to a pod remaining unscheduled (pending) if the condition isn’t met.
In particular, anti-affinity rules could be leveraged to protect critical workloads from sharing the kubelet with non-critical ones. By doing so, the lack of computational optimization will not affect the entire node pool, but just a few instances that will contain business-critical units.
Example of node affinity
apiVersion: v1
kind: pod
metadata:
  name: node-affinity-example
spec:
  affinity:
   nodeAffinity:
      preferredDuringSchedulingIgnoredDuringExecution:
       - weight: 1
         preference:
          matchExpressions:
          - key: net-segment
            operator: In
            values:
            -  segment-x
      requiredDuringSchedulingIgnoredDuringExecution:
        nodeSelectorTerms:
        - matchExpressions:
          - key: workloadtype
            operator: In
            values:
            - p0wload
            - p1wload
  containers:
  - name: node-affinity-example
    image: registry.k8s.io/pause:2.0
The node is preferred to be in a specific network segment by label and it is required to match either a p0 or p1 workloadtype (custom strategy).
Multiple operators are available and NotIn and DoesNotExist are the specific ones usable to obtain node anti-affinity. From a security standpoint, only hard rules requiring the conditions to be respected matter. The preferredDuringSchedulingIgnoredDuringExecution configuration should be used for computational configurations that can not affect the security posture of the cluster.
Inter-pod affinity and anti-affinity could constrain which nodes the pods can be scheduled on, based on the labels of pods already running on that node.
As specified in Kubernetes documentation:
“Inter-pod affinity and anti-affinity rules take the form “this pod should (or, in the case of anti-affinity, should not) run in an X if that X is already running one or more pods that meet rule Y”, where X is a topology domain like node, rack, cloud provider zone or region, or similar and Y is the rule Kubernetes tries to satisfy.”
Example of anti-affinity
affinity:
  podAntiAffinity:
    requiredDuringSchedulingIgnoredDuringExecution:
    - labelSelector:
        matchExpressions:
        - key: app
          operator: In
          values:
          - testdatabase
In the podAntiAffinity case above, we will never see the pod running on a node where a testdatabase app is running.
It fits designs where it is desired to schedule some pods together or where the system must ensure that certain pods are never going to be scheduled together. In particular, the inter-pod rules allow engineers to define additional constraints within the same execution context without further creating segmentation in terms of node groups. Nevertheless, complex affinity rules could create situations with pods stuck in pending status.
Taints are the opposite of node affinity properties since they allow a node to repel a set of pods not matching some tolerations. They can be applied to a node to make it repel pods unless they explicitly tolerate the taints.
Tolerations are applied to pods and they allow the scheduler to schedule pods with matching taints. It should be highlighted that while tolerations allow scheduling, the decision is not guaranteed.
Each node also defines an action linked to each taint: NoExecute (affects running pods), NoSchedule (hard rule), PreferNoSchedule (soft rule).
The approach is ideal for environments where strong isolation of workloads is required. Moreover, it allows the creation of custom node selection rules not based solely on labels and it does not leave flexibility.
You can use topology spread constraints to control how pods are spread across your cluster among failure-domains such as regions, zones, nodes, and other user-defined topology domains. This can help to achieve high availability as well as efficient resource utilization.
Kubernetes by default uses the kube-scheduler which follows its own set of criteria for scheduling pods. While the default scheduler is versatile and offers a lot of options, there might be specific security requirements that the default scheduler might not know about. Writing a custom scheduler allows an organization to apply a risk-based scheduling to avoid pairing privileged pods with pods processing or accessing sensitive data.
To create a custom scheduler, you would typically write a program that:
Some examples of a custom scheduler that can be adapted for this can be found at the following GH repositories: kubernetes-sigs/scheduler-plugins or onuryilmaz/k8s-scheduler-example.
Additionally, a good presentation on crafting your own is Building a Kubernetes Scheduler using Custom Metrics - Mateo Burillo, Sysdig. As mentioned in the talk, this is not for the faint of heart because of the complexity and you might be better off just sticking with the default one if you are not already planning to build one.
As described, scheduling policies could be used to attract or repel pods into specific group of nodes.
While a proper strategy reduces the blast radius of a compromised pod, there are still some aspects to take care of from the attacker perspective. In specific cases, the implemented mechanisms could be used either to:
Bonus Section: Node labels security
Normally, the kubelet will still be able to modify labels for a node, potentially allowing a compromised node to tamper with its own labels to trick the scheduler as described above.
A security measure could be applied with the NodeRestriction admission plugin. It basically denies labels editing from the kubelet if the node-restriction.kubernetes.io/ prefix is present in the label.
Security-wise, dedicated nodes for each namespace/service would constitute the best setup. However, the design would not exploit the Kubernetes capability to optimize computations.
The following examples represent some trade-off choices:
The core concept for a successful approach is having a set of reserved nodes for critical namespaces/workloads. Real world scenarios and complex designs require engineers to plan the fitting mix of mechanisms according to performance requirements and risk tolerance.
This decision starts with defining the workloads’ risks:
Different teams, different trust level
It’s not uncommon for large organizations to have multiple teams deploying to the same cluster. Different teams might have different levels of trustworthiness, training or access. This diversity can introduce varying levels of risks.
Data being processed or stored
Some pods may require mounting customer data or having persistent secrets to perform tasks. Sharing the node with any workload with less hardened workloads may expose the data to a risk
Exposed network services on the same node
Any pod that exposes a network service increases its attack surface. pods interacting with external-facing requests may suffer from this exposure and be more at risk of compromise.
pod privileges and capabilities, or its assigned risk
Some workloads may need some privileges to work or may run code that by its very nature processes potentially unsafe content or third-party vendor code. All these factors can contribute to increasing a workload’s assigned risk.
Once the set of risks within the environment are found, decide the isolation level for teams/data/network traffic/capabilities. Grouping them, if they are part of the same process, could do the trick.
At that point, the amount of workloads in each isolation group should be evaluable and ready to be addressed by mixing the scheduling strategies, according to the size and complexity of each group.
Note: Simple environments should use simple strategies and avoid mixing too many mechanisms if few isolation groups and constraints are present.
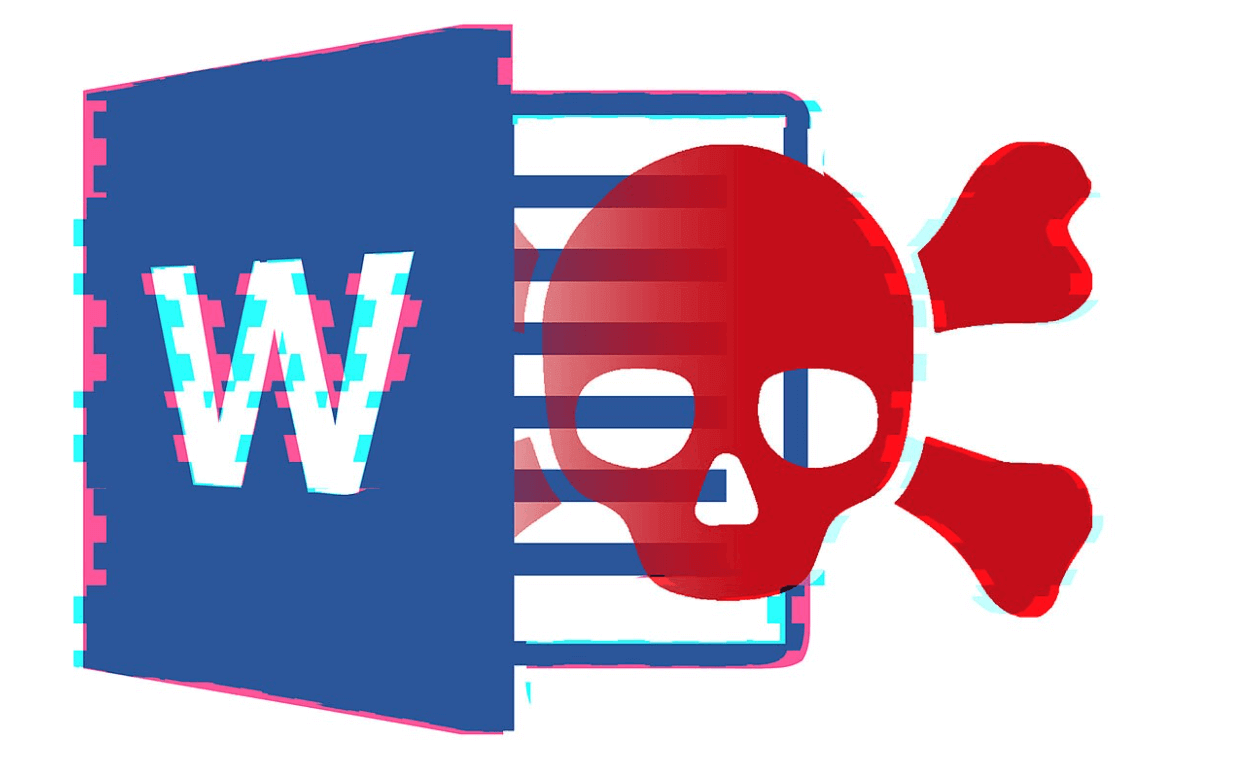
Hello, folks! We’re back with an exciting update on Session Hijacking Visual Exploitation (SHVE) that introduces an insidious twist to traditional exploitation techniques using Office documents. We all know how Office documents laced with macros have been a longstanding entry point for infiltrating systems. SHVE now takes a step further by leveraging XSS vulnerabilities and the inherent trust users have in websites they regularly visit.
Our newest feature integrates the concept of Office document poisoning. Here’s how it works: SHVE allows you to upload templates for .docm, .pptm, and .xslm formats. Whenever a victim of SHVE goes to download one of these document types, the tool will automatically intercept and inject the malicious macros into the file before it is downloaded. What makes this technique particularly sneaky is that the document appears completely normal to the user, maintaining the original content and layout. However, in the background, it executes the malicious payload, unbeknownst to the user.
This approach capitalizes on two critical aspects: the trust users have in documents they download from legitimate websites they visit, and the inherent dangers of macros embedded within Office documents. By combining these two elements, we create a subtle vector for delivering malicious payloads. It’s the wolf in sheep’s clothing, where everything looks as it should be, but the danger lurks within.
To provide a clear demonstration of this technique, we’ve prepared a video illustrating this Office document poisoning in action. Witness how a seemingly innocent download can turn into a nightmare for the end user.
As security researchers and ethical hackers, we need to constantly evolve and adapt our methods. With this update, SHVE not only allows for the exploitation of XSS vulnerabilities but also cleverly abuses the trust mechanisms users have built around their daily digital interactions. This enhancement is not just a step forward in terms of technical capability, but also a reminder of the psychological aspects of security exploitation.
We’re eager to see how the community will leverage these new features in their penetration testing and red teaming engagements. As always, we welcome contributions, and we’re looking forward to your feedback and insights. Stay safe, and happy hacking!
There is a ton of code that is not worth your time and brain power. Binary reverse engineers commonly skip straight to the important code by using ltrace, strace, or frida. You can do the same for client side JavaScript using only common browser features. This will save time, make testing more fun and help keep your attention span available for the code that deserves your focus.
This blog introduces my thinking processes and practical methods for instrumenting client side JavaScript. This processes have helped me to find deeply embedded bugs in complicated codebases with relative ease. I have been using many of these tricks for so long that I implemented them in a web extension called Eval Villain. While I will introduce you to some of Eval Villain’s brand new features, I will also show how to get the same results without Eval Villain.
Testing an application often raises questions as to how the application works. The client must know the answers to some of these questions if the application is to function. Consider the following questions:
For the web page to work, it needs to know the answer to these questions. This
means we can find our answers in the JavaScript too. Notice that each of these
questions imply the use of particular JavaScript functions. For example, how
would the client implement a post message handler without ever calling
addEventListener? So “Step 1” is hooking these interesting functions,
verifying the use case is what we are interested in and tracing back. In
JavaScript, it would look like this:
(() => {
    const orig = window.addEventListener;
    window.addEventListener = function(a, b) {
        if (a === "message") {
            console.log("postMessage handler found");
            console.log(b); // You can click the output of this to go directly to the handler
            console.trace(); // Find where the handler was registered.
        }
        return orig(...arguments);
    }
})();
Just pasting the above code in the console will work if the handler has not already been registered. However, it is crucial to hook the function before it’s even used. In the next section I will show a simple and practical way to always win that race.
Hooking native JavaScript is “Step 1”. This often helps you find interesting code. Sometimes you will want to instrument that code but it’s non-native. This requires a different method that will be covered in the “Step 2” section.
While you can use one of many web extensions that will add arbitrary JavaScript to the page, I don’t recommend it. These extensions are often buggy, have race conditions and are difficult to develop in. In most cases, I find it easier to just write my own extension. Don’t be daunted, it is really easy. You only need two files and I already made them for you here.
To load the code in Firefox go to about:debugging#/runtime/this-firefox in
the URL bar, click Load Temporary Add-on and navigate to the manifest.json
file in the top directory of the extension.
For chrome, go to chrome://extensions/, enable developer mode in the right
side and click load unpacked.
The extension should show up in the addon list, where you can quickly
enable or disable it. When enabled, the script.js file will load in every web
page. The following lines of code log all input to document.write.
	/*********************************************************
	 ***  Your code goes goes here to run in pages scope  ***
	 *********************************************************/

	// example code to dump all arguments to document.write
	document.write = new Proxy(document.write, {
		apply: function(_func, _doc, args) {
			console.group(`[**] document.write.apply arguments`);
				for (const arg of args) {
					console.dir(arg);
				}
			console.groupEnd();
			return Reflect.apply(...arguments);
		}
	});
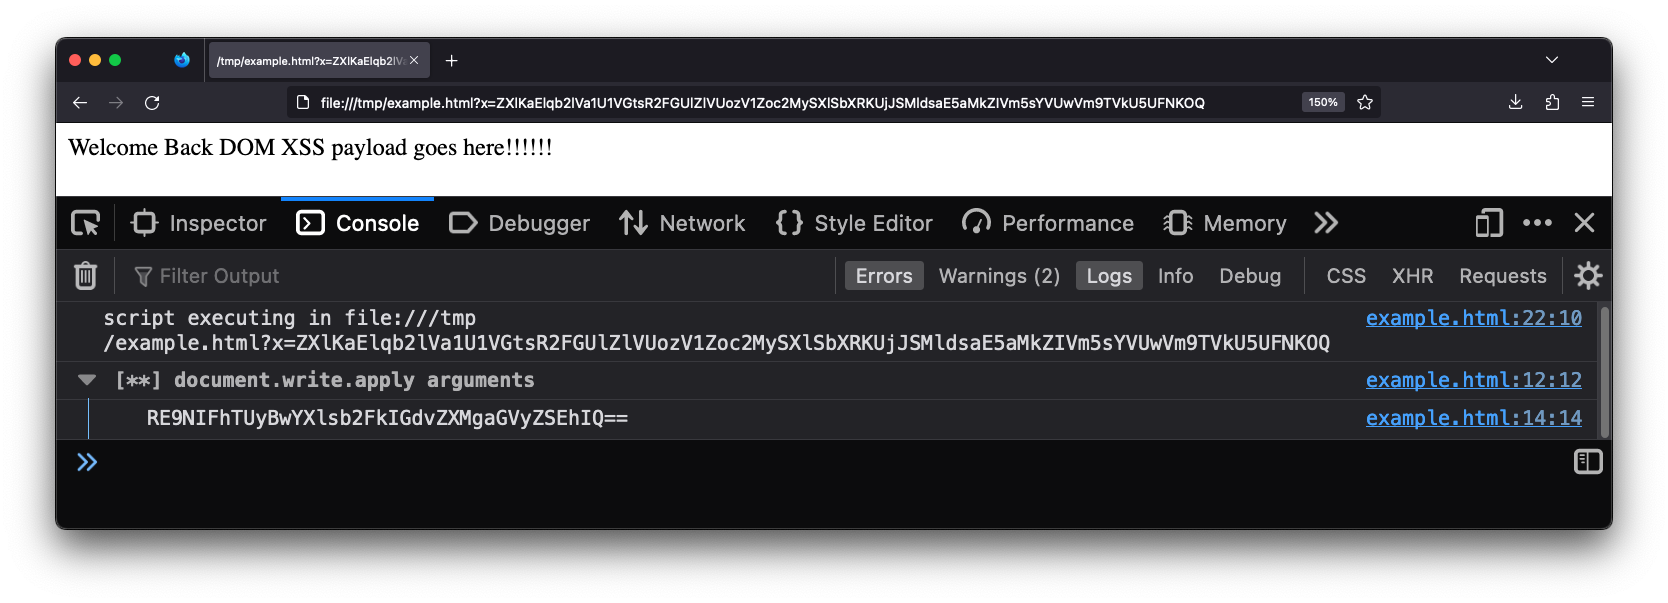
Replace those lines of code with what ever you want. Your code will run in every page and frame before the page has the opportunity to run its own code.
The boiler plate uses the manifest file to register a content script. The manifest tells the browser that the content script should run in every frame and before the page loads. Content scripts do not have direct access to the scope of the page they are loaded into but they do have direct access to the DOM. So the boiler plate code just adds a new script into the pages DOM. A CSP can prohibit this, so the extension checks that it worked. If a CSP does block you, just disable the CSP with browser configs, a web extension or an intercepting proxy.
Notice that the instrumentation code ultimately ends up with the same privileges as the website. So your code will be subject to the same restrictions as the page. Such as the same origin policy.
A quick word of warning. The above content script will give you first access to
the only JavaScript thread. The website itself can’t run any JavaScript until
you give up that thread. Try it out, see if you can make a website that runs
document.write before the boiler plate has it hooked.
First access is a huge advantage, you get to poison the environment that the website is about to use. Don’t give up your advantage until you are done poisoning. This means avoiding the use of async functions.
This is why many web extensions intended to inject user JavaScript into a page are buggy. Retrieving user configuration in a web extension is done using an async call. While the async is looking up the user config, the page is running its code and potentially has already executed the sink you wanted to hook. This is why Eval Villain is only available on Firefox. Firefox has a unique API that can register the content script with the user configuration.
It is very rare that I run into a “Step 1” situation that can’t be solved with Eval Villain. Eval Villain is just a content script that hooks sinks and searches input for sources. You can configure almost any native JavaScript functionality to be a sink. Sources include user configure strings or regular expressions, URL parameters, local storage, cookies, URL fragment and window name. These sources are recursively decoded for important substrings. Let’s look at the same page of the example above, this time with Eval Villain in its default configuration.
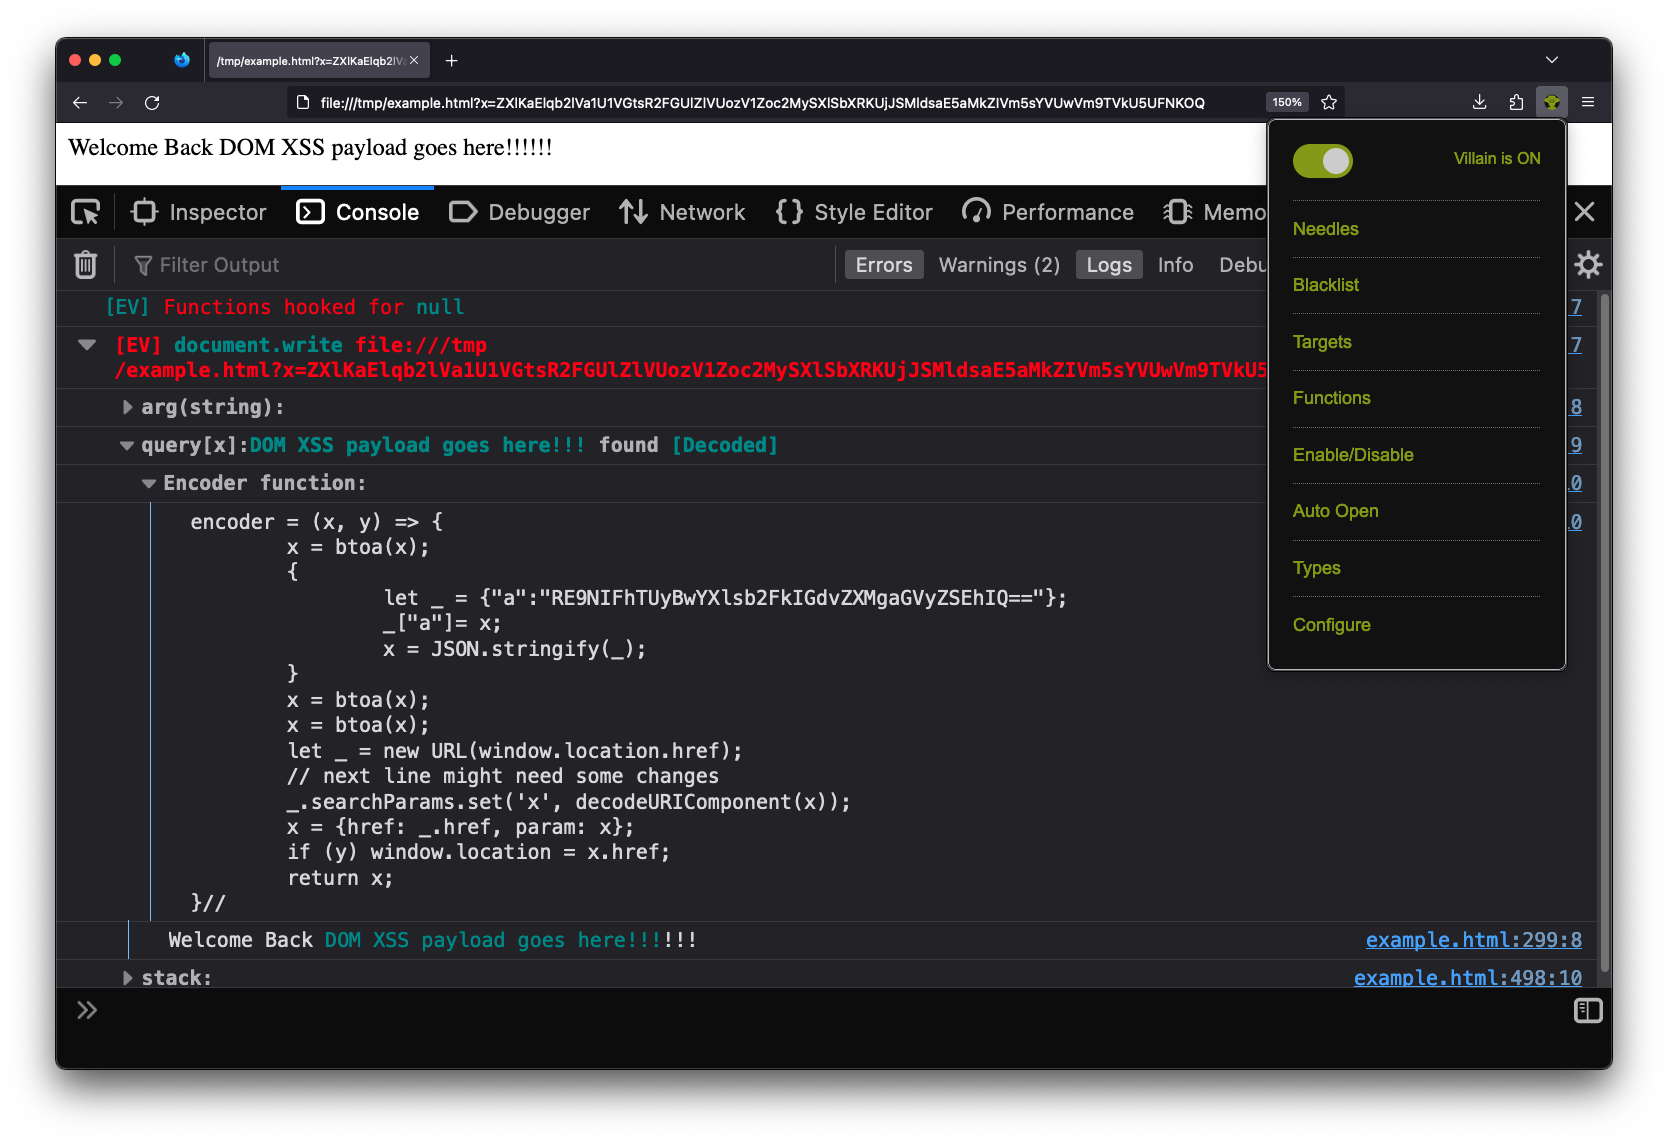
Notice this page is being loaded from a local file://. The source code is
seen below.
<script>
let x = (new URLSearchParams(location.search)).get('x');
x = atob(x);
x = atob(x);
x = JSON.parse(x);
x = x['a'];
x = decodeURI(x);
x = atob(x);
document.write(`Welcome Back ${x}!!!`);
</script>
Even though the page has no web requests, Eval Villain still successfully hooks
the user configured sink document.write before the page uses it. There is no
race condition.
Also notice that Eval Villain is not just displaying the input of
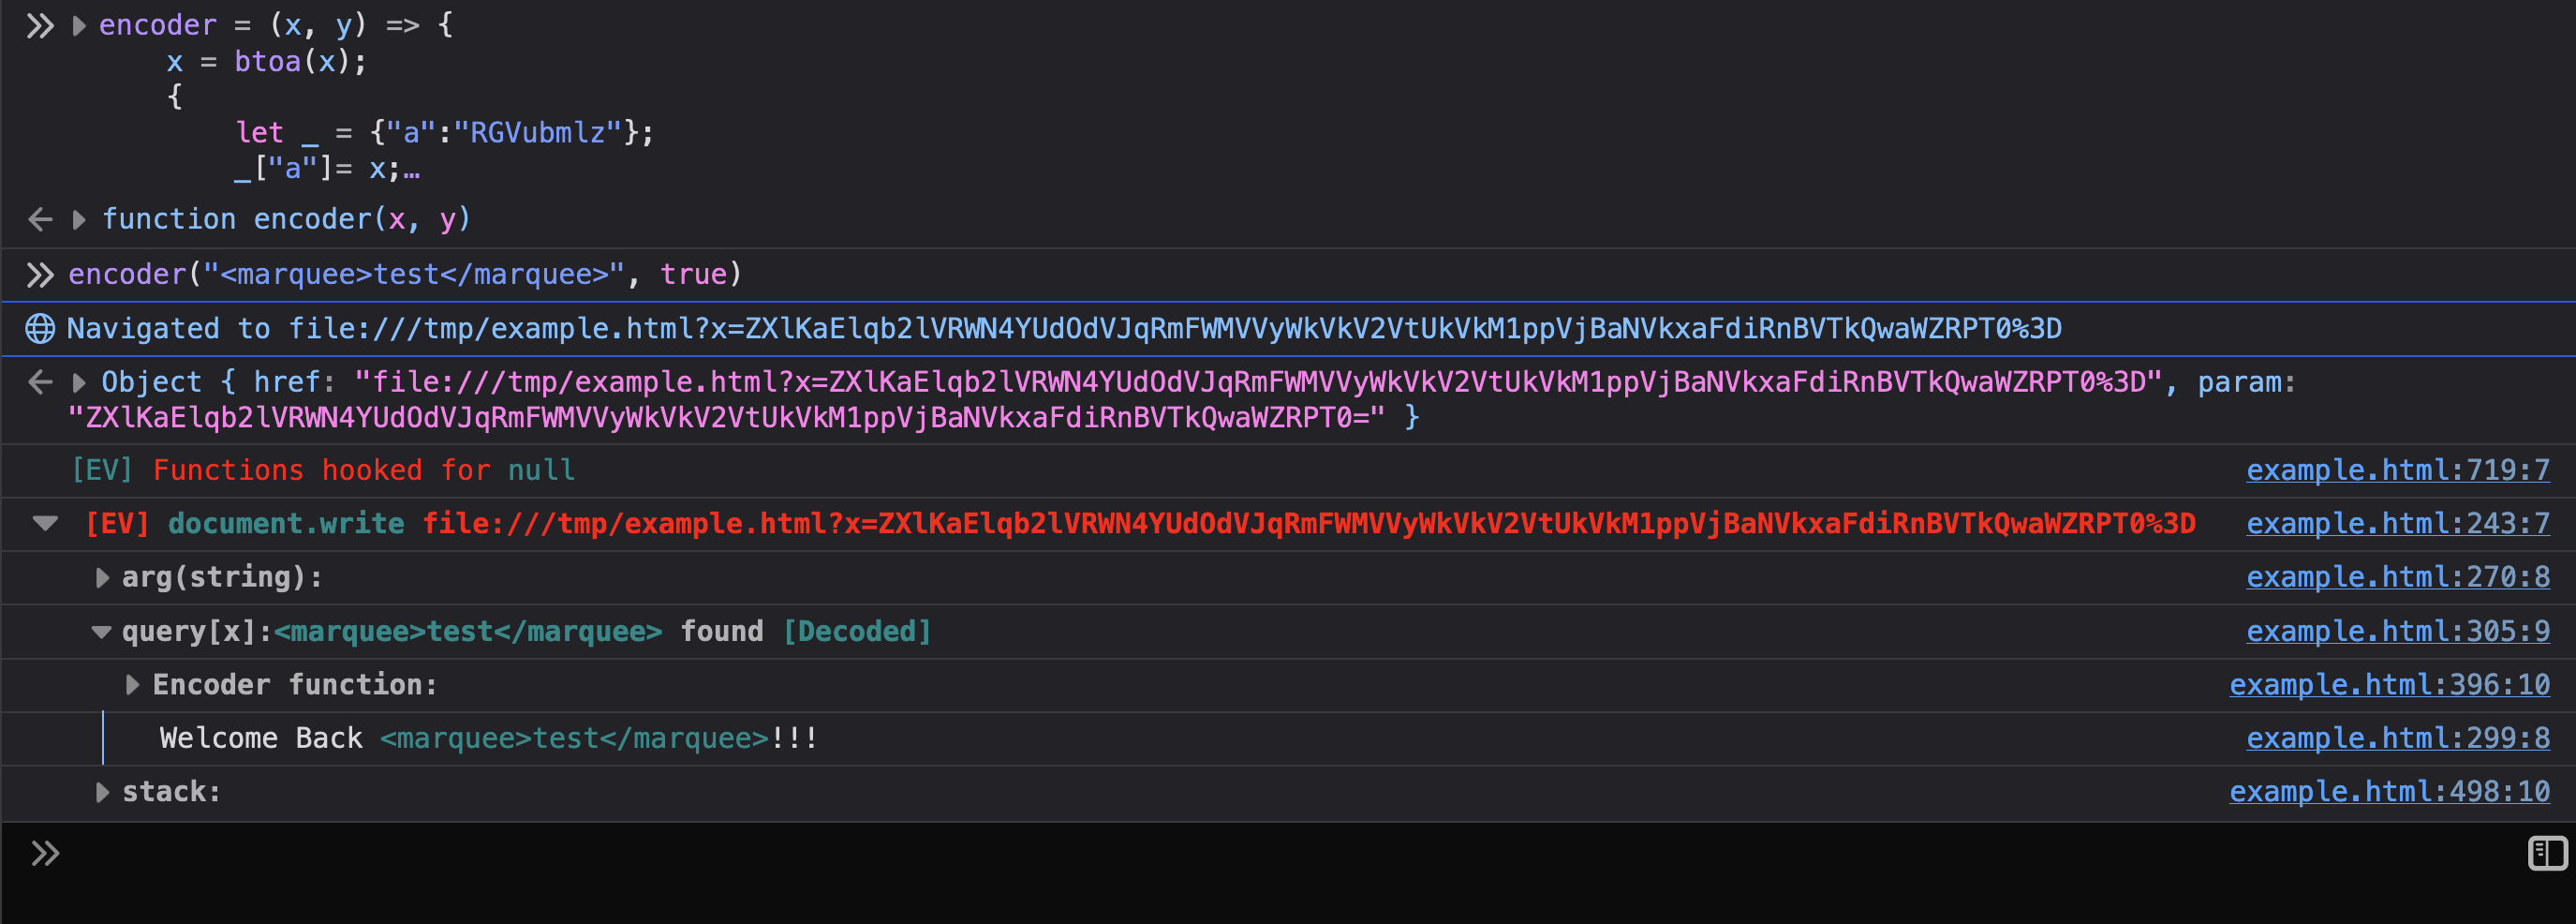
document.write. It correctly highlighted the injection point. The URL
parameter x contained an encoded string that hit the sink document.write.
Eval Villain figured this out by recursively decoding the URL parameters. Since
the parameter was decoded, a encoder function is provided to the user. You
can right click, copy message and paste it into the console. Using the
encoder function lets you quickly try payloads. Below shows the encoder
function being used to inject a marquee tag into the page.
If you read the previous sections, you know how this all works. Eval Villain is just using a content script to inject its JavaScript into a page. Anything it does, you can do in your own content script. Additionally, you can now use Eval Villain’s source code as your boiler plate code and customize its features for your particular technical challenge.
So lets say you used “Step 1” to get a console.trace from an interesting
native function. Maybe a URL parameter hit your decodeURI sink and now your
tracing back to the URL parsing function. There is a mistake I regularly make
in this situation and I want you to do better. When you get a trace, don’t
start reading code yet!
Modern web applications often have polyfills and other cruft at the top of the
console.trace. For example, the stack trace I get on google search results
page starts with functions iAa, ka, c, ng, getAll. Don’t get tunnel
vision and start reading ka when getAll is obviously what you want. When
you look at getAll, don’t read source! Continue to scan, notice that getAll
is a method and it’s sibling are get, set, size, keys, entries and
all the other methods listed in the URLSearchParams
documentation.
We just found multiple custom URL parsers, re-implemented in minified code
without actually reading the code. “Scan” as much as you can, don’t start reading
code deeply until you find the right spot or scanning has failed you.
Instrumenting native code didn’t result in vulnerabilities. Now you want to instrument the non-native implementation itself. Let me illustrate this with an example.
Let’s say you discovered a URL parser function that returns an object named
url_params. This object has all the key value pairs for the URL parameters.
We want to monitor access to that object. Doing so could give us a nice list of
every URL parameter associated to a URL. We may discover new parameters this
way and unlock hidden functionality in the site.
Doing this in JavaScript is not hard. In 16 lines of code we can have a well
organized, unique list of URL parameters associated to the appropriate page and
saved for easy access in localStorage. We just need to figure out how to
paste our code right into the URL parser.
function parseURL() {
    // URL parsing code
    // url_params = {"key": "value", "q": "bar" ...

    // The code you want to add in
    url_params = new Proxy(url_params, {
        __testit: function(a) {
            const loc = 'my_secret_space';
            const urls = JSON.parse(localStorage[loc]||"{}");
            const href = location.protocol + '//' + location.host + location.pathname;
            const s = new Set(urls[href]);
            if (!s.has(a)) {
                urls[href] = Array.from(s.add(a));
                localStorage.setItem(loc, JSON.stringify(urls));
            }
        },
        get: function(a,b,c) {
            this.__testit(b);
            return Reflect.get(...arguments);
        }
    };
    // End of your code

    return url_params;
}
Chrome’s dev tools will let you type your own code into the JavaScript source but I don’t recommend it. At least for me, the added code will disappear on page load. Additionally, it is not easy to manage any instrumentation points this way.
I have a better solution and it’s built into Firefox and Chrome. Take your
instrumentation code, surround it with parenthesis, add && false to
the end. The above code becomes this:
(url_params = new Proxy(url_params, {
    __testit: function(a) {
        const loc = 'my_secret_space';
        const urls = JSON.parse(localStorage[loc]||"{}");
        const href = location.protocol + '//' + location.host + location.pathname;
        const s = new Set(urls[href]);
        if (!s.has(a)) {
            urls[href] = Array.from(s.add(a));
            localStorage.setItem(loc, JSON.stringify(urls));
        }
    },
    get: function(a,b,c) {
        this.__testit(b);
        return Reflect.get(...arguments);
    }
}) && false
Now right click the line number where you want to add your code, click “conditional breakpoint”.
Paste your code in there. Due to the && false the condition will never be
true, so you won’t ever get a breakpoint. The browser will still execute our
code and in the scope of function where we inserted the breakpoint. There are
no race conditions and the breakpoint will continue to live. It will show up in
new tabs when you open the developer tools. You can quickly disable individual
instrumentation scripts by just disabling the assisted breakpoint. Or disable
all of them by disabling breakpoints or closing the developer tools window.
I used this particular example to show just how far you can go. The instrumented code will save URL parameters, per site, to a local storage entry. At any given page you can auto-populate all known URL parameters into the URL bar by pasting the following code in to the console.
(() => {
const url = location.protocol + '//' + location.host + location.pathname;
const params = JSON.parse(localStorage.getItem("my_secret_space"))[url];
location.href = url + '?' + params.flatMap( x => `${x}=${x}`).join('&');
})()
If you use this often, you can even put the code in a bookmarklet.
Nothing says we can’t use native and non-native functions at the same time. You can use a content script to implement big fancy codebases. Export that functionality to the global scope and then use it in a conditional breakpoint.
This brings us to the latest feature of Eval Villain. Your conditional can make use of Eval Villains recursive decoding feature. In the pop-up menu click “configure” and go to the “globals” section. Ensure the “sourcer” line is enabled and click save.
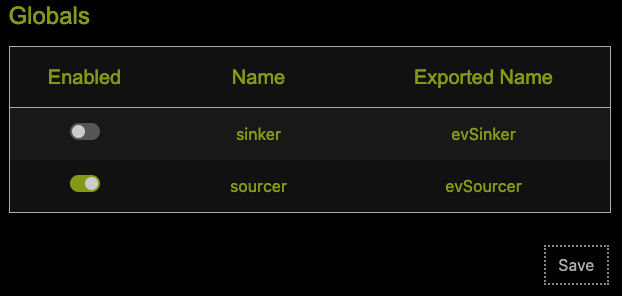
I find myself enabling/disabling this feature often, so there is a second
“enable” flag in the popup menu itself. It’s in the “enable/disable” menu as
“User Sources”. This causes Eval Villain to export the evSourcer function to
the global name scope. This will add any arbitrary object to the list of
recursively decoded sources.
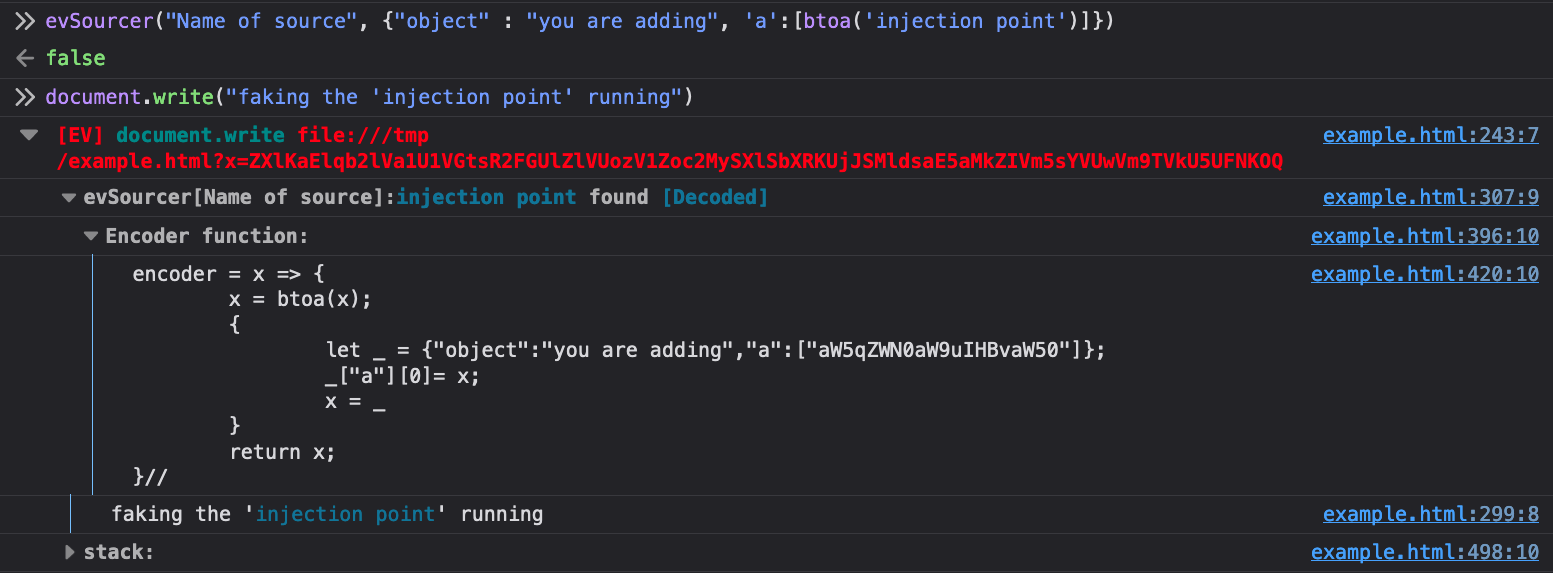
As can be seen, the first argument is what you name the source. The second is
the actual object you want to search sinks. Unless there is a custom encoding
that Eval Villain does not understand you can just put this in raw. There is an
optional third argument that will cause the sourcer to console.debug every
time it’s invoked. This function returns false, so you can use it as a
conditional breakpoint anywhere. For example, you can add this as a conditional
breakpoint that only runs in the post message handler of interest, when
receiving messages from a particular origin as a means of finding if any part
of a message will hit a DOM XSS sink. Using this in the right place can
alleviate SOP restrictions placed on your instrumentation code.
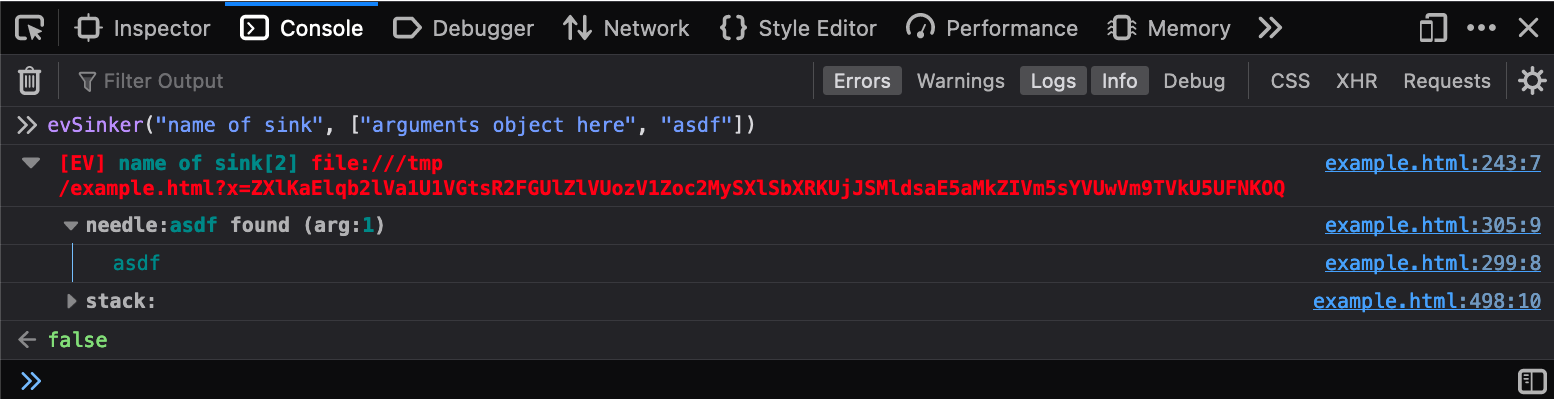
Just like the evSourcer there is an evSinker. I rarely use this, so there
is no “enable/disable” entry for this in the popup menu. It accepts a sink name
and a list of arguments and just acts like your own sink. It also returns false
so it can easily be used in conditional breakpoints.
Writing your own instrumentation is a powerful skill for vulnerability research. Sometimes, it only takes a couple of lines of JavaScript to tame a giant gully codebase. By knowing how this works, you can have better insight into what tools like Eval Villain and DOM invader can and can’t do. Whenever necessary, you can also adapt your own code when a tool comes up short.